

Bitcoin Spot Rally Peaks at $81,000: Institutional Distribution and ETF Outflows Trigger Liquidation Reset
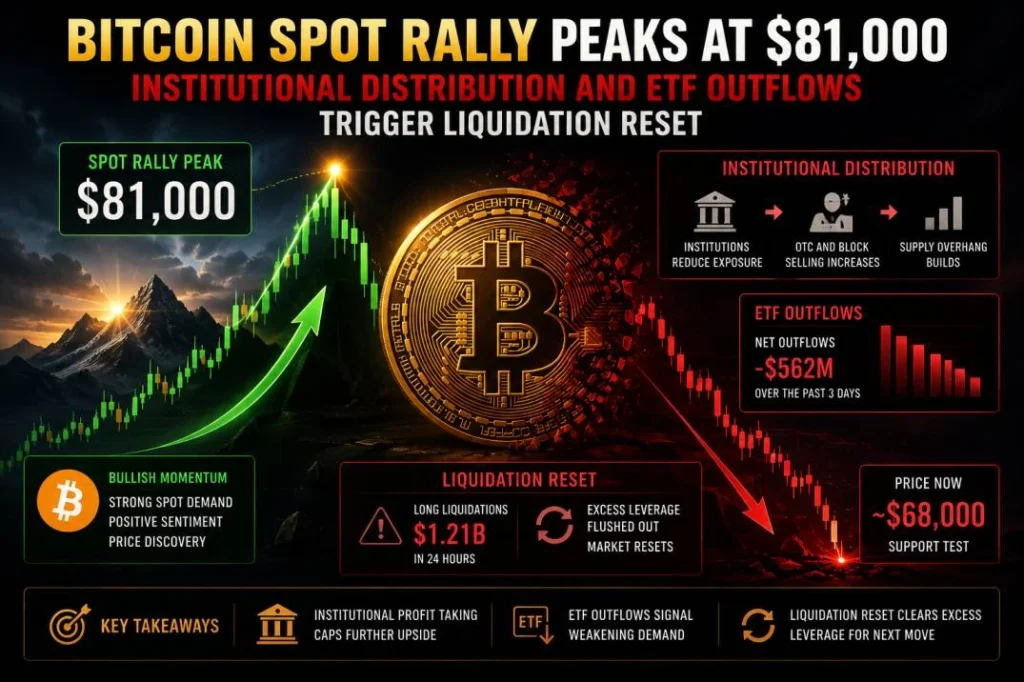
The digital asset market has entered a aggressive structural correction after the Bitcoin spot rally peaks within an intense 48-hour window between May 5 and May 6, 2026. After surging to an intraday local peak of approximately $81,000, Bitcoin ($BTC$) encountered severe institutional distribution. This distribution effectively capped upside expansion, trapping overleveraged momentum buyers and setting the stage for a dramatic liquidity flush.
The subsequent correction accelerated sharply into early June. The price broke down through crucial support levels to print multi-week lows near $65,370. This move triggered over $1.8 billion in forced crypto market liquidations in a single day—the most severe leverage flush seen since February.
Understanding this correction requires moving past retail panic narratives. Instead, we must examine the intersection of institutional order flow, systemic derivatives updates, and changing global macro conditions.
1. The Anatomy of the Peak: Institutional Distribution vs. Retail FOMO
The price action observed when the Bitcoin spot rally peaks on May 5 exemplifies classic institutional distribution within a low-liquidity window. As spot prices crossed $80,000, order book depth on institutional venues like Coinbase Prime and FalconX revealed a significant imbalance. Large-scale passive sell walls capped further price appreciation, even as retail buying momentum accelerated on retail-facing derivatives platforms.
On-chain data indicates this ceiling was constructed by multi-year whales and institutional allocators executing programmatic TWAP (Time-Weighted Average Price) exit strategies. This distribution did not stem from a sudden loss of confidence in digital assets. Rather, it represented a calculated rebalancing as portfolio risk limits were triggered near the psychological $81,000 threshold.
As spot demand slowed down, the market became overly reliant on derivatives leverage to sustain its upward path. This structural divergence between stagnant spot purchasing and expanding perpetual swap open interest created an unstable foundation, making a sharp correction inevitable.
2. The Multi-Billion Dollar ETF Redemption Streak
A primary driver behind the transition from institutional distribution to active price decline has been the unprecedented streak of spot Bitcoin ETF outflows. Over an 11-day period leading into early June, aggregate net redemptions across US spot products reached an estimated $2.8 billion to $3.5 billion.
[Institutional Macro Risk-Off]
        │
        ▼
[Simultaneous ETF Redemptions] ──> (IBIT / FBTC / GBTC / ARKB)
        │
        ▼
[Market Makers Sell Spot Inventory] ──> Sharp Decline Below $71,000 Support
This represents the longest consecutive streak of negative inflows since the vehicle’s inception in January 2024. Crucially, the redemptions occurred symmetrically across major issuers, including BlackRock’s iShares Bitcoin Trust ($IBIT$), Fidelity’s $FBTC$, Grayscale’s $GBTC$, and Ark Invest’s $ARKB$.
This uniform outflow across competitive funds confirms that the selling pressure is macro-driven institutional de-risking rather than a flight from any single product structure. When an institutional allocator redeems ETF shares, authorized participants (APs) must return those shares to the issuer in exchange for the underlying Bitcoin, which is subsequently liquidated on spot desks. This sustained selling pressure quickly depleted the residual spot liquidity across major OTC desks, removing the primary price floor that had supported the market throughout the spring.
3. Macro Catalysts: Geopolitical Tensions and the Energy Overhang
The institutional shift away from risk assets was accelerated by significant macroeconomic and geopolitical developments in May 2026.
The Persian Gulf Escalation
Renewed geopolitical friction in the Persian Gulf—headlined by the suspension of key diplomatic talks between the US and Iran—triggered an immediate risk-off reaction across global financial markets. While traditional equities showed resilience due to isolated tech sector strength, capital allocators reduced exposure to alternative, high-beta assets.
Energy Costs and Inflation Expectations
The geopolitical standoff caused an immediate spike in crude oil volatility. Higher energy costs directly disrupt the disinflationary trajectory the Federal Reserve has targeted, complicating expectations for future interest rate cuts. For institutional digital asset strategies, persistent inflation coupled with tight central bank liquidity presents a difficult environment. This dynamic reduces the excess fiat liquidity that typically flows into speculative digital assets.
The Strategy Treasury Anomaly
Sentiment suffered a further psychological blow when corporate treasury giant MicroStrategy executed its first-ever recorded sale of Bitcoin, offloading 32 BTC at an average price of $77,135 to generate roughly $2.5 million. While the nominal size of this transaction is tiny relative to their total holdings of over 840,000 BTC, the narrative shift was significant. Quantitative trading models and systematic trend-followers interpreted the transaction as a break in the firm’s strict, multi-year accumulation playbook, which amplified the algorithmic selling pressure.
4. The June Leverage Reset: Derivative Mechanics & CME Volatility Futures
When Bitcoin fell below the key structural support level of $71,000, it triggered a massive cascade of forced long liquidations. In the derivatives market, long positions are automatically closed out by exchange engines when maintenance margin requirements fail. This creates mandatory market sell orders that rapidly depress prices further.
Aggregate crypto market liquidations reached $1.8 billion within 24 hours, with leveraged long positions accounting for $1.35 billion of the damage. This forced liquidation wave represents a comprehensive clearing of speculative froth from the system.
Bitcoin Drops Below $71,000
        │
        ▼
Forced Margin Calls Triggered
        │
        ▼
Automated Liquidation Engines Market-Sell BTC
        │
        ▼
Cascading Price Drop to Intraday Low ($65,370)
The Role of CME Volatility Futures
An underappreciated element of this leverage reset was the launch of Bitcoin Volatility futures by CME Group on June 1, 2026. Settling to the CME CF Bitcoin Volatility Index (BVX), these contracts allow institutional desks to isolate and trade implied volatility independently of price direction.
In the days surrounding the launch, institutional options desks engaged in sophisticated delta-neutral unwinding. To prepare variance trading strategies for the new regulated instrument, market makers adjusted their spot and perpetual hedges. This institutional rebalancing increased short-term volatility, helping drive the price down to its intraday low of $65,370.
5. Structural Impact: Pros, Cons, and Systemic Risks
This market reset presents distinctly divergent implications for short-term traders and long-term ecosystem health.
Pros
- Systemic De-risking: Clearing billions in speculative leverage reduces the risk of a broader, systemic market crash driven by cascading liquidations.
- Lower Funding Rates: Perpetual swap funding rates have reset to baseline or negative levels, lowering the cost capital for directional positioning.
- Institutional Entry Pricing: The correction resets valuation metrics back toward the cost basis of long-term value investors, offering an attractive reentry window.
Cons
- Impaired Sentiment: The rapid decline below major psychological levels damages short-term retail and systematic trend-following sentiment.
- ETF Capital Stagnation: Sustained outflows slow down net asset growth across crypto investment products, temporarily cooling Wall Street adoption narratives.
- Heightened Volatility Overhang: The introduction of complex volatility instruments like CME’s BVX futures may structurally increase intra-week price swings.
6. Technical Outlook: Crucial Support Levels and Reversal Signals
Following the wash-out to $65,370, Bitcoin’s technical structure resides at a critical juncture. The asset is hovering just above its key medium-term pivotal support at $62,250, which aligns with the lower boundary of its long-term ascending channel.
Ascending Channel Upper Boundary: $82,815 (Resistance)
────────────────────────────────────────────────────────
Intermediate Resistance:           $74,880
────────────────────────────────────────────────────────
Current Consolidation Zone:        $65,000 - $70,000
────────────────────────────────────────────────────────
Pivotal Medium-Term Support:       $62,250 (Must Hold)
Several contrarian indicators suggest that the intense selling pressure may be nearing exhaustion:
- Oversold Momentum: The daily Relative Strength Index (RSI) touched a deeply oversold reading of 21.8, an extreme level historically associated with local price bottoms.
- On-Chain Illiquidity: The percentage of 1-year active supply has dropped from 40.3% to 39.3% over the past three weeks. This indicates that long-term holders (LTHs) are keeping their coins offline, removing available supply from the market during this decline.
If buyers can establish a stable base above $62,250, intermediate overhead resistance sits at $74,880. Clearing that level would open the door for a retest of the major trendline resistance near $82,815, completing the market’s recovery cycle.
FAQ SECTION
– Why did the Bitcoin spot rally peak at $81,000?
- The Bitcoin spot rally peaked due to institutional distribution on spot exchanges, where large-scale sell blocks met heavy retail momentum buying. This structural distribution capped price upside, leaving the market highly reliant on leverage just as institutional demand began to slow.
– How did spot Bitcoin ETF outflows affect the market?
- Sustained outflows totaling an estimated $2.8 billion to $3.5 billion over 11 consecutive days forced authorized participants to liquidate the underlying spot Bitcoin on open markets. This constant selling pressure quickly depleted OTC desk liquidity and broke key technical support levels.
– What caused the $1.8 billion in crypto market liquidations?
- The price drop below the $71,000 support level triggered automated liquidation engines across derivatives platforms. Overleveraged long positions were systematically closed out via market orders, creating a cascading sell-off that pushed prices down to multi-week lows.
– What are CME Bitcoin Volatility futures?
- Launched on June 1, 2026, CME Bitcoin Volatility futures are regulated contracts that settle to the CME CF Bitcoin Volatility Index (BVX). They allow market participants to trade and hedge 30-day forward-looking implied volatility directly, separating volatility exposure from price direction.
– Is the current Bitcoin market structure bullish or bearish long-term?
- Long-term, the market structure remains intact within a secular ascending channel. While the near-term flush caused significant damage to leveraged long positions, the reduction in funding rates and ongoing accumulation by long-term holders suggest the structural foundation remains healthy.
FINANCIAL DISCLAIMER
Disclaimer: This article is provided purely for informational and educational purposes. It does not constitute financial, investment, legal, or tax advice. Digital assets, including Bitcoin and associated derivative instruments, carry an extreme level of risk and volatility. Past performance is not indicative of future market outcomes. Readers must conduct independent research and consult with a licensed financial advisor before executing any market transactions. The publication and author assume no liability for capital losses incurred as a direct or indirect result of the information contained herein.