
Bitcoin Implied Volatility Drops to Historic Lows: Options Calm Defies Macro Stress
The global macroeconomic landscape is flashing late-cycle warning signals. US Treasury yields are hardening, geopolitical tensions are escalating, and the MOVE index—the definitive barometer for bond market volatility—has surged from 69% to 85%. Yet, inside the cryptocurrency derivatives ecosystem, the mood resembles an eerie tranquil pool.
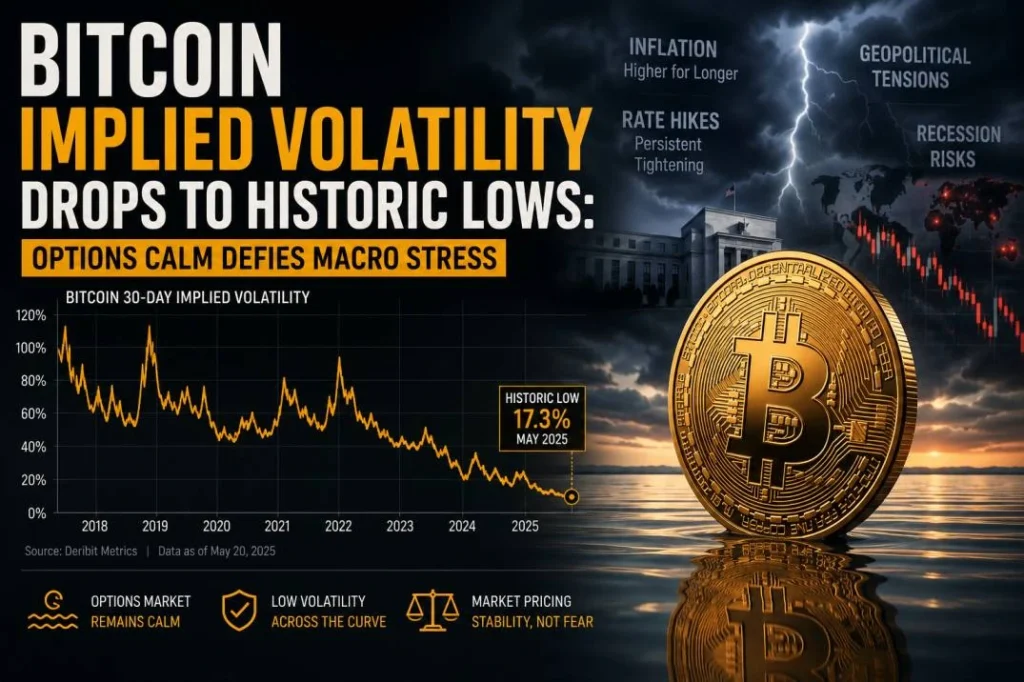
During the first week of May 2026, Bitcoin implied volatility drops to historic lows, with the 1-month options contract compressing heavily down to the 37% mark. This profound options-market stagnation occurred right before a structural shift in spot order books, leaving unhedged directional traders exposed as defensive put layers were aggressively unwound across major derivatives venues.
The Mechanics of the 37% Volatility Compression
Implied volatility (IV) represents the market’s forward-looking estimate of price dispersion, mathematically embedded into options premiums via pricing formulas like Black-Scholes. When Bitcoin implied volatility drops to historic lows, options premiums become significantly cheaper, signaling that market participants are underpricing the probability of large tail-risk movements.
[Macro Stress Escalates: MOVE Index 69% ➔ 85%]
                        │
                        ▼  (Divergence)
[Bitcoin 1-Month Implied Volatility Collapses to 37%]
                        │
                        ▼  (Market Impact)
[Defensive Puts Unwound ➔ Market Maker Negative Gamma Built Up at $75K]
This structural flattening of the volatility curve down to 37% was driven by a unique confluence of institutional capital dynamics:
- Systematic Call-Overwriting: Institutional yield funds and spot ETF participants have spent the first half of 2026 executing systematic call-overwriting strategies. By continuously selling out-of-the-money (OTM) calls to capture premium income, these large-scale players structurally suppressed the upper bounds of the volatility surface.
- The Unwinding of Defensive Puts: As Bitcoin established a temporary consolidation range between $75,000 and $78,000, multi-asset desks began aggressively unwinding the defensive put layers they had established during the turbulent first quarter. This broad capitulation of downside protection buyers starved options market makers of natural vega (volatility sensitivity) demand.
- Realized Volatility Suppression: Spot market volume delta remained net-neutral for several consecutive weeks. Because underlying realized volatility dragged along multi-month floors, options market makers were forced to continuously mark down their implied volatility expectations across the 30-day curve.
The Macro Disconnect: BVIV vs. The MOVE Index
The structural divergence between the Bitcoin Volatility Index (BVIV) and legacy financial stress indicators is unprecedented in the post-ETF era. Historically, since the institutionalization of Bitcoin via spot ETFs, the digital asset has maintained a positive correlation with macro liquidity cycles and fixed-income volatility.
When bonds experience severe repricing, risk assets usually follow. However, in early May, as institutional capital pulled over $2 billion out of US spot Bitcoin ETFs due to shifting Federal Reserve rate expectations, the options market completely ignored the capital flight.
According to data from Deribit, the world’s premier crypto options exchange holding over 70% of global open interest, options premiums dropped to absolute value terms rarely seen outside of late-stage bear market winters. The options market behaved as if Bitcoin had transitioned into a stable utility asset, ignoring the fact that the underlying spot asset was hovering precariously close to key structural trendlines.
Market Maker Positioning and the Gamma Trap
To understand why this volatility compression left traders exposed, one must look at dealer positioning. As defensive put layers were unwound by fund managers, options market makers absorbed those contracts, shifting their own risk profiles.
Data from Glassnode and proprietary order flow analytics indicated that dealer positioning had become heavily concentrated into the May monthly options expiration. Crucially, a massive cluster of negative gamma was sitting directly at the $75,000 strike price, representing billions in nominal open interest.
Pro Tip: What is Negative Gamma?
When market makers are short options contracts (net negative gamma), they are forced to trade with the prevailing trend to remain delta-neutral. If the spot price drops, they must sell spot assets to hedge; if the spot price rises, they must buy spot assets. This loop acts as an algorithmic accelerator for price extensions.
| Metric / Market Indicator | Early May 2026 Value | Structural Market Impact |
| 1-Month Implied Volatility (IV) | 37.0% | Deep premium discount; options buying is cheap |
| US Treasury MOVE Index | 85.0% | Extreme macro stress; fixed-income instability |
| 25-Delta Risk Reversal | Negative Skew | Puts remain slightly more expensive than calls |
| STH Cost Basis Alignment | ~$78,000 | Spot market is structurally top-heavy |
This options-market configuration turned the $75,000 to $78,000 zone into a high-stakes threshold. On-chain metrics showed the Short-Term Holder (STH) Cost Basis converging near $78,000. With spot prices lacking clear upward momentum and market-maker negative gamma compounding below $75,000, the historic drop in implied volatility was not a sign of fundamental safety—it was an atmospheric pressure drop ahead of a structural storm.
Evaluating Volatility Regimes: Pros, Cons, and Structural Trade-offs
A prolonged low-volatility environment introduces distinct operational trade-offs for different market participants. While it lowers systemic entry costs, it also masks underlying liquidity deficiencies.
Advantages of Low Implied Volatility Regimes
- Asymmetric Volatility Buying: For non-directional volatility traders, buying options via long straddles or strangles becomes highly cost-effective. When IV is at 37%, the underlying asset needs to make a relatively small percentage move to outrun the option’s premium cost.
- Cheaper Downside Hedging: Portfolio managers holding large spot allocations can establish long-dated protective puts at a fraction of typical bull-market costs, preserving capital against macro tail-risk events.
- Suppressed Liquidation Risks: Low structural volatility minimizes the occurrence of sudden, leveraged cascade liquidations across perpetual swap venues, allowing organic spot order books to dictate short-term pricing.
Disadvantages and Hidden Risks
- Premium Decay (Theta Burn): Directional options buyers face rapid portfolio decay if the spot asset continues to chop sideways, as time decay systematically erodes option values.
- The Volatility Inversion Risk: When implied volatility drops significantly below realized historical norms, any sudden external shock can trigger an explosive “volatility spike.” In these events, the cost of protection skyrockets instantly, trapping short-volatility sellers in highly unprofitable cover trades.
- Anemic Market Maker Liquidity: Extended periods of compressed premiums reduce the profitability of market-making desks, occasionally causing them to thin out their order depth across far-out-of-the-money strikes.
Strategic Playbook: Trading the Volatility Breakout
When Bitcoin implied volatility drops to historic lows amid rising external macroeconomic stress, history suggests that the status quo is fundamentally unsustainable. Sophisticated market participants generally pivot away from directional betting and focus on structural volatility positioning.
1. Long Straddles Ahead of Macro Catalysts
Given that the options market is severely underpricing macro risks, buying a 30-day at-the-money (ATM) call and an ATM put simultaneously (a long straddle) allows traders to profit purely from an expansion in volatility. The direction of the break is irrelevant; the position wins as long as Bitcoin moves aggressively enough in either direction to outrun the compressed entry premium, or if macro uncertainty forces the 1-month IV curve to re-rate from 37% back toward its historical baseline of 55%.
2. Hedging via Convexity Profiles
Institutions holding massive spots should avoid selling covered calls at the bottom of an IV cycle. The premium gained is historically nominal, while the risk of having assets called away during an explosive, low-volatility breakout is high. Instead, capital allocations should favor buying cheap, out-of-the-money puts near the market maker negative gamma walls to insulate portfolios against systematic unwind events.
FAQ SECTION
– What does it mean when Bitcoin’s implied volatility drops to historic lows?
- When Bitcoin’s implied volatility drops to historic lows, it means the options market is pricing in exceptionally small expected price movements for the digital asset over a specific time horizon. Options premiums become very cheap, indicating widespread market complacency or structural selling of options by institutional yield-generation strategies.
– How does Bitcoin’s 1-month implied volatility compression affect retail traders?
- While it directly alters the derivatives landscape, it indirectly impacts retail traders by altering spot market dynamics. Low implied volatility leads to cheaper options, which encourages institutional hedging and volatility strategies. However, if the compression occurs alongside a buildup of negative market-maker gamma, it can cause violent, unexpected price cascades if key support levels break.
– What is the relationship between the MOVE Index and Bitcoin options pricing?
- The MOVE Index measures implied volatility in the US Treasury options market, serving as an indicator of global macroeconomic and bond-market stress. Typically, a rising MOVE index hints at risk-off liquidity conditions. When Bitcoin options pricing declines while the MOVE index climbs, it highlights a structural disconnect where crypto derivatives are underpricing macroeconomic risks.
– Why did the unwinding of defensive puts leave traders exposed in May 2026?
- As Bitcoin consolidated, traders chose to unwind their defensive puts to cut hedging costs, assuming the market was safe. This aggressive selling of puts forced market makers to rebalance their books, concentrating negative gamma at lower strikes. When the market shifted, traders lacked protective hedges, while market makers were forced to sell spot assets to maintain delta-neutrality, exacerbating the downward price move.
– What trading strategies work best when Bitcoin IV touches the 37% mark?
- When 1-month implied volatility touches the 37% mark, short-volatility strategies like selling premium become highly risky due to poor risk-reward ratios. Instead, traders look toward long-volatility setups, such as long straddles or long strangles, which benefit from a sharp breakout in price or a sudden correction and normalization of the volatility index.
FINANCIAL DISCLAIMER
This article is provided for informational and educational purposes only. It should not be construed as financial, legal, or investment advice. Digital assets and derivatives trading involve a high degree of risk, including the loss of principal capital. Readers should conduct independent research and consult with a licensed financial advisor before executing any market strategies.