
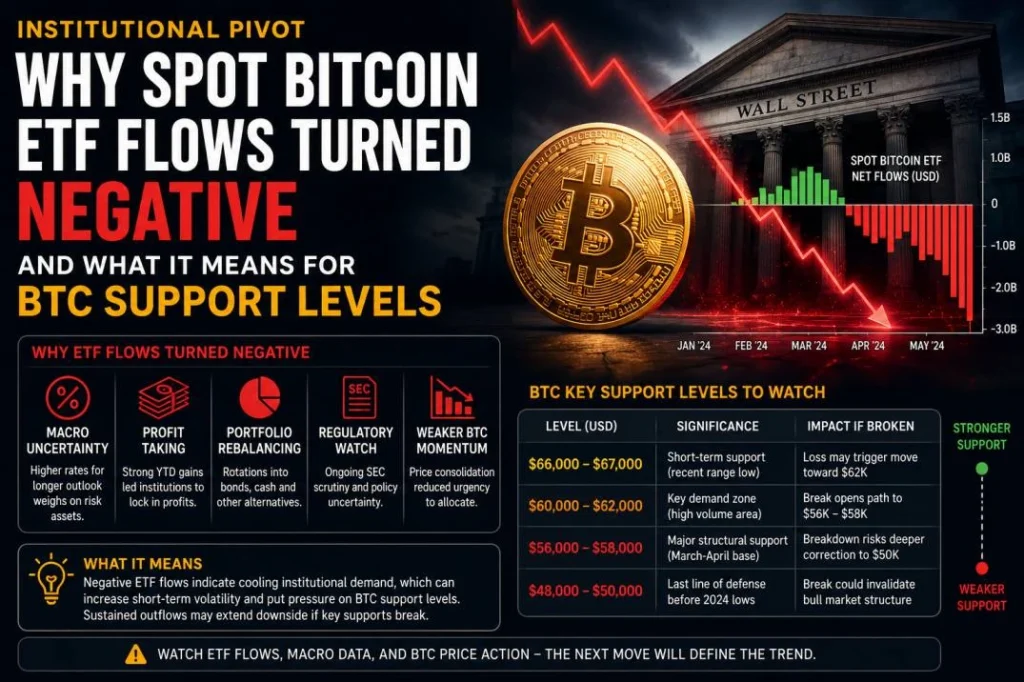
Institutional Pivot: Why Spot Bitcoin ETF Flows Turned Negative and What It Means for BTC Support Levels
The structural mechanics governing digital asset markets underwent a fundamental regime shift at the mid-month mark of May 2026. After a highly consistent six-week run of positive capital accumulation, U.S. spot Bitcoin ETF flows turned negative between May 14 and May 15, 2026. This sudden reversal effectively snapped a multi-billion-dollar positive streak and initiated a multi-day net outflow cycle that immediately dragged down spot prices.
                  [THE ETF FLOW COLLAPSE TRACK]

   May 1-13, 2026        May 14-15, 2026        May 16-17, 2026
  ───────────────────   ───────────────────   ───────────────────
  Persistent Inflows    The Turning Point     Spot Correction
  Strong Institutional  Net Flows Flip to     BTC Drops ~21%
  Bid Powers Rally.     Negative Territory.   Toward Key Support.
The significance of this turning point lies not just in the nominal dollar amounts withdrawn, but in what it reveals about the shifting profile of the marginal buyer. For over a year, regulated exchange-traded products served as the primary demand engine for Bitcoin, consistently absorbing structural miner selling and on-chain whale distribution.
When that institutional bid vanished over a 48-hour window, the lack of immediate organic spot liquidity beneath the market was laid bare. The resulting vacuum triggered a broad spot price correction that accelerated into the weekend of May 16–17, resetting leverage and altering the near-term technical outlook for the asset class.
The Mid-Month Inflection: Deconstructing the May 14–15 Reversal
On May 14, 2026, the aggregate net flow across the eleven U.S. spot Bitcoin ETF issuers shifted into negative territory for the first time in 30 sessions. The bleeding worsened on May 15, confirming that the initial drop was not an isolated settlement anomaly but a coordinated institutional pause.
   [MAY 14-15 REVERSAL ACCOUNTABILITY]
   ┌────────────────────────────────────────┐
   │ BlackRock (IBIT)             ~75%      │
   ├───────────────────────────┬────────────┤
   │ Fidelity (FBTC)           │ ~12%       │
   ├───────────────────────────┼────────────┤
   │ Grayscale (GBTC)          │ ~8%        │
   ├───────────────────────────┼────────────┤
   │ Others                    │ ~5%        │
   └───────────────────────────┴────────────┘
BlackRock’s iShares Bitcoin Trust (IBIT), which had functioned as the dominant engine for capital absorption throughout early 2026, sat at the epicenter of the reversal. IBIT accounted for roughly 75% of the total volume withdrawn during the initial phase of the outflow streak.
This concentration highlights a key structural reality: the largest institutional vehicles are inherently vulnerable to macro-driven asset allocation shifts. When major wealth platforms and institutional capital allocators decide to temporarily de-risk, the impact is felt almost entirely within the highest-liquidity products.
This multi-day redemption streak quickly trickled out to other major market participants, including Fidelity’s FBTC, Grayscale’s GBTC, and ARK’s ARKB. The synchronized nature of these redemptions confirms that the asset class was experiencing a top-down macroeconomic reallocation rather than a localized flight from any single issuer’s product structure.
Macro Headwinds and the Catalyst Matrix
This sudden shift in institutional demand did not occur in a vacuum. A combination of changing macroeconomic conditions, rising geopolitical tensions, and localized corporate treasury actions combined to create a challenging environment for risk assets.
1. Macroeconomic Pressures and Sticky Inflation
The primary driver behind the institutional shift was a clear change in global macroeconomic conditions. U.S. inflation data printed higher than anticipated, with the ISM Prices Paid index climbing above the 80 threshold. This sticky inflation print immediately pushed the 10-year U.S. Treasury yield toward 4.43%, driving up real yields and dampening institutional appetite for non-yielding speculative assets.
While traditional equities managed to decouple temporarily on idiosyncratic artificial intelligence earnings growth, digital assets reacted directly to this restrictive liquidity landscape.
2. Geopolitical Escalation in the Middle East
Risk-off sentiment was further amplified by a sudden breakdown in diplomatic channels. Tensions in the Middle East spiked after diplomatic communications between Washington and Tehran were suspended following strikes in Lebanon.
The resulting concerns over energy security and potential disruptions in the Strait of Hormuz kept crude oil prices elevated. This provided another inflation headwind that forced systematic macro funds to reduce their exposure to high-beta alternative assets.
3. Corporate Treasury Rotations
The cautious mood was compounded by localized selling pressure from prominent corporate holders. MicroStrategy, a key corporate buyer since 2020, executed a targeted sale of 32 BTC at an average price of approximately $77,135.
While a 32 BTC distribution is negligible relative to the company’s massive treasury position exceeding 840,000 BTC, the timing of the sale had an outsized psychological impact. It signaled to the market that even the most committed corporate treasuries were willing to actively manage their positions around local technical resistance lines.
Spot Price Correction and Market Impact
The immediate consequence of spot Bitcoin ETF flows turning negative was a swift unwinding of leveraged positions in the derivatives market. As the institutional buy wall disappeared, Bitcoin’s spot price broke below the $71,000 level, a key technical line that had supported the market throughout the early May expansion.
[SPOT PRICE CORRECTION VS DERIVATIVES RESET]
May 13: BTC at $80,000+ (Peak Institutional Inflows)
May 14-15: ETF Flows Turn Negative (Bid Disappears)
May 16-17: Spot Price Flushes to ~Mid-$60k Range
Result: $1.8 Billion in Forced Liquidations (Largest since Feb 2026)
The break below $71,000 triggered a severe long squeeze during the weekend of May 16–17. Because weekend spot liquidity on centralized exchanges is historically thin, the cascading liquidations of overleveraged long positions had a highly destructive impact on price discovery. Total forced liquidations across all derivatives venues topped $1.8 billion within a single 24-hour window—the largest single-day deleveraging event since February 2026. Long positions accounted for $1.35 billion of that total.
This price correction dragged Bitcoin down from its early May highs above $80,000 into the mid-$60,000 range. This move tested the lower boundaries of its medium-term trading channel and shifted the broader market sentiment from greed to explicit caution.
Institutional Profit-Taking vs. Structural Capitulation
To understand where the market goes from here, you have to distinguish between structural capitulation and cyclical profit-taking. Mainstream financial commentary often conflates any major ETF outflow with a total abandonment of the asset class. However, an analysis of order routing and cumulative holdings suggests a more nuanced reality.
According to data from CryptoQuant, overall speculative and spot demand contracted significantly during this period, dropping by roughly 501,000 BTC over the broader monthly cycle. This represents the fastest monthly drop in absolute demand metrics since the post-Terra/Luna collapse of May 2022.
Institutional Breakdown: Despite the alarming drop in headline demand, cumulative net inflows into U.S. spot Bitcoin ETFs since their January 2024 launch still stand at an impressive $58.72 billion. The core asset base remains intact.
Furthermore, dynamic trade tracking revealed a $1.29 billion dark-pool block trade involving roughly 29.2 million shares of BlackRock’s IBIT. The execution of a multi-billion-dollar block trade within a closed liquidity venue indicates institutional position reallocation and tax-advantaged rebalancing rather than chaotic market dumping.
Large institutions do not route orders through dark pools when they are panicking; they use them to methodically adjust their exposure without triggering an unmanageable price impact on public order books.
Technical and On-Chain Support Mapping
With the institutional bid on pause, Bitcoin must rely on its underlying on-chain support zones and historical technical indicators to find a price floor. Traders are closely watching three primary defense lines to see if the market can stabilize.
| Support Category | Price Level | Technical / On-Chain Significance |
| Immediate Technical Support | $65,000 – $65,710 | Local intraday lows; marks the lower boundary of the post-halving consolidation range. |
| On-Chain Short-Term Holder Realized Price | $60,000 – $61,500 | Represents the average acquisition cost for recent buyers. Historically serves as a strong price floor during bull market corrections. |
| Macro Structural Support (S2) | $51,000 | The ultimate macro floor. A break below this level would invalidate the broader structural expansion thesis for 2026. |
The 14-day Relative Strength Index (RSI) dropped to 31.68 following the weekend flush, placing the asset on the verge of deeply oversold territory. Historically, when the daily RSI approaches the 30 line while the asset is testing its short-term holder realized price, it signals an exhaustive sell-off that often precedes a strong relief rally.
Core Risks and Potential Catalysts
Downside Risks
- Extended Capital Outflows: If U.S. spot Bitcoin ETF net flows remain negative for an extended period, the market will lose its primary source of structural demand, which could lead to a slow grind down toward the $51,000 macro floor.
- Geopolitical Disruption: Any further escalation in the Middle East that limits transit through the Strait of Hormuz could cause an energy price shock, pushing inflation higher and keeping central banks hawkish.
Upside Catalysts
- Network Upgrades: The upcoming activation of the Glamsterdam and Hegotá network upgrades later in 2026 promises to improve transaction throughput and MEV fairness, which could attract a fresh wave of programmatic institutional interest.
- Macro Stabilization: A cooling of U.S. jobs and PMI data could lower bond yields, creating a more favorable environment for digital asset inflows to resume.
FAQ SECTION
– Why did spot Bitcoin ETF flows turn negative in mid-May 2026?
- The shift was primarily driven by macro-driven asset allocation changes. Higher-than-expected U.S. inflation data pushed the 10-year Treasury yield to 4.43%, forcing institutional allocators to de-risk. This pressure was compounded by rising geopolitical tensions in the Middle East and targeted profit-taking from major corporate treasuries.
– Which specific Bitcoin ETF saw the largest outflows during this period?
- BlackRock’s iShares Bitcoin Trust (IBIT) experienced the largest volume of withdrawals, accounting for roughly 75% of the total aggregate net outflows recorded across the entire U.S. ETF complex during the initial leg of the redemption streak.
– How did the derivatives market react when the ETF bid turned negative?
- The disappearance of institutional buying pressure triggered a major long squeeze. Over $1.8 billion in leveraged positions were hit with forced liquidations within a 24-hour window, with long positions accounting for $1.35 billion of the total liquidations.
– Does this outflow trend mean institutional investors are permanently abandoning Bitcoin?
- No. Data indicates this trend represents cyclical profit-taking and strategic portfolio rebalancing rather than a structural exit. Cumulative net inflows since the January 2024 product launches remain highly stable at over $58 billion, and large-scale dark-pool block trades point to ordered reallocations instead of panic capitulation.
– What are the key technical support levels for Bitcoin following this correction?
- The immediate technical support floor sits between $65,000 and $65,710. Below that, the short-term holder realized price between $60,000 and $61,500 serves as the critical line for maintaining the broader market’s upward momentum.
FINANCIAL DISCLAIMER
This article is provided for informational and analytical purposes only. It does not constitute investment, financial, legal, or tax advice. Digital assets are subject to high market volatility and structural risks. Institutional fund flows and historical performance metrics are not reliable indicators of future price performance. Consult a qualified financial advisor before making any investment decisions.