
Why Aggressive ETF Outflows and Prediction Market Pessimism Are Dragging Bitcoin Down
The institutional veneer that protected the digital asset market throughout early 2026 has begun to show structural fractures. For over two years, traditional finance capital served as a structural floor for crypto valuations. However, a sharp macro regime shift has turned that floor into a source of intense distribution pressure.
The convergence of aggressive ETF outflows & prediction market pessimism has fundamentally altered the short-term market structure for Bitcoin ($BTC$). The asset is under clear pressure around the critical $60,000 threshold, driven by structural capital rotation rather than retail panic.
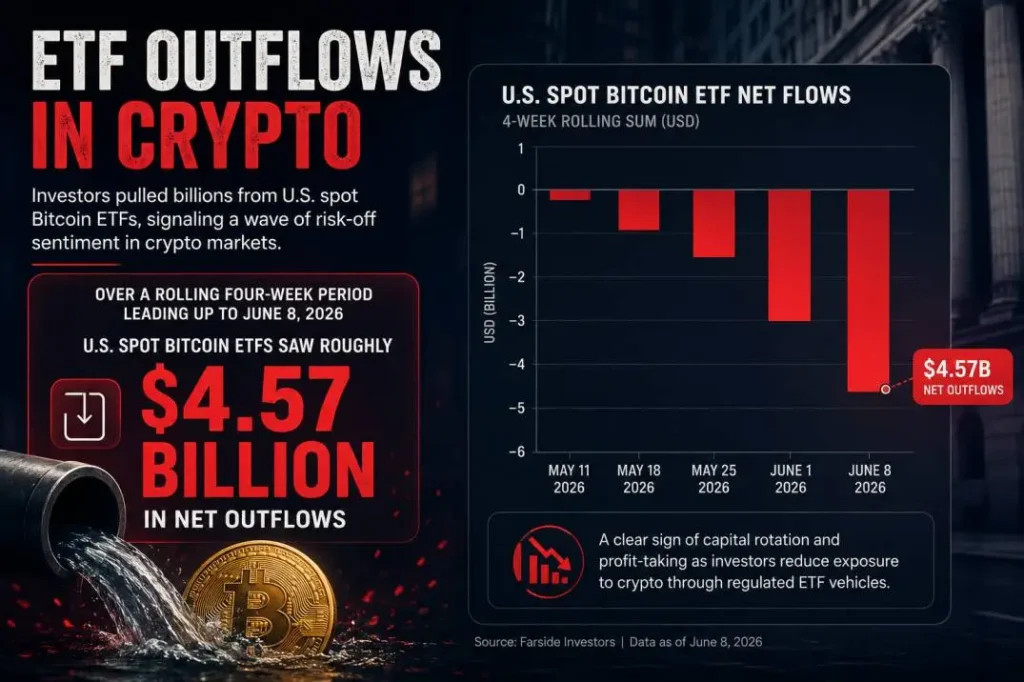
The numbers reveal the scale of this capital flight. Over a rolling four-week period leading up to June 8, 2026, U.S. spot Bitcoin ETFs saw roughly $4.57 billion in net outflows. This multi-week redemption streak represents one of the largest capital exoduses since the SEC approved these vehicles in January 2024. This sustained capital drain has cleared out a massive amount of derivatives market open interest and sparked a significant sentiment shift on decentralized and regulated prediction platforms like Polymarket and Kalshi.
                                  [Fed Hawkish Pivot]
                                           │
                                           ▼
                              [10-Year Treasury Yields ↗]
                                           │
                                           ▼
                       [Institutional Basis Trade Unwinds]
                                           │
                    ┌──────────────────────┴──────────────────────┐
                    ▼                                             ▼
       [Aggressive ETF Outflows]                      [Prediction Market Pessimism]
  ($4.57B Net Redemptions in 4 Weeks)              (Sub-$60k Odds Spike to 62% - 83%)
                    │                                             │
                    └──────────────────────┬──────────────────────┘
                                           ▼
                             [Bitcoin Spot Liquidity Drain]
                                           │
                                           ▼
                       [Whale Wallets Realize $2.5B in Losses]
Macroeconomic Pressures and Interest Rate Sentiment
The primary driver behind this institutional exit is a fundamental repricing of global liquidity conditions. The Federal Reserve’s mid-year policy guidance removed previous language regarding “sustained progress toward the 2% inflation target.” Coupled with hawkish commentary from key voting members hinting that anticipated interest rate cuts could be delayed into late 2027, macroeconomic pressures and interest rate sentiment hit risk assets hard.
When risk-free rates march higher—exemplified by the 10-year U.S. Treasury yield climbing toward multi-month highs—the opportunity cost of holding a non-yielding, volatile asset like Bitcoin rises dramatically. For traditional portfolio managers, the decision to trim crypto exposure is basic asset allocation math:
$$Risk\ Adjusted\ Return = \frac{E(R_p) – R_f}{\sigma_p}$$
As the risk-free rate ($R_f$) increases, the target expected return on volatile assets must expand significantly to justify its position in a multi-asset portfolio. Instead of holding spot Bitcoin ETF products through a period of macro uncertainty, institutional desks are shifting back to short-duration yield instruments.
The Mechanics of the ETF Capital Flight
The $4.57 billion outflow sequence was not evenly distributed across the ETF landscape. A granular review of fund-level data shows that while some smaller issuers saw flat or minor net flows, heavy-liquidity vehicles like BlackRock’s IBIT and Fidelity’s FBTC absorbed the brunt of the redemptions.
| ETF Fund Name | Rolling 4-Week Net Flow (Est.) | AUM Impact Range (June 2026) | Primary Participant Behavior |
| BlackRock (IBIT) | -$2.85 Billion | -12% to -15% | Systematic Unwinding / Basis Trade |
| Fidelity (FBTC) | -$1.20 Billion | -10% to -13% | Multi-Asset Allocator Derisking |
| Grayscale (GBTC) | -$520 Million | Continued Secular Bleed | Fee Optimization Redemptions |
| Other Issuers (Combined) | -$0 Million | Stable / Minor Churn | Inactive Retail / Long-term Holders |
This concentrated selling points directly to the unwinding of the institutional “basis trade”—where hedge funds buy spot ETFs and simultaneously short CME futures to capture premium. As funding rates compressed due to broader market stagnation, the profitability of this arbitrage collapsed. The resulting unwinding forced simultaneous selling in the spot market via ETF redemptions and the closure of short positions in the derivatives market, causing aggregate open interest to fall sharply.
Prediction Markets as Sentiment Leading Indicators
While technical analysts watch moving averages, the smart money has looked toward decentralized and regulated prediction platforms to quantify market risk. On-chain betting behavior has flipped highly bearish, matching the spot market sell-off.
On platforms like Polymarket and Kalshi, traders have actively priced in a 62% to 83% probability that Bitcoin will break below the psychological $60,000 support level before staging any meaningful rally back toward $100,000.
Insight from the Order Books: Prediction markets are unique because they strip away the bias of traditional commentary. When a trader buys a “Yes” contract on a sub-$60,000 Bitcoin price target on Kalshi, they are backing that view with hard capital. This creates a highly accurate, real-time index of aggregate institutional and sophisticated retail sentiment.
This level of prediction market pessimism acts as a self-fulfilling prophecy for spot market liquidity. Market makers and desk traders use these shifting implied probabilities to adjust their bids on spot exchanges, lowering their buy walls to account for the heightened probability of a downward spike.
On-Chain Reality: Whales and Realized Losses
The impact of this institutional exit is clearly visible on-chain. According to data monitored via Glassnode, the distribution phase has moved past simple paper losses. Newer whale wallets—defined as addresses holding more than 1,000 BTC that have been active for less than six months—have realized roughly $2.5 billion in actual losses as the asset slid toward the low-$61,000 range.
[On-Chain Transfer] -> ETF Issuer Custodial Wallet -> Outflow to Coinbase Prime -> Spot Liquidation
This cohort’s average cost basis sits uncomfortably close to the current spot price. When these wallets capitulate and realize losses, it indicates that even large-scale market participants are prioritizing capital preservation over long-term conviction, adding further overhead supply to spot exchanges.
Strategic Perspectives: The Institutional Ledger
To evaluate this current correction objectively, it is necessary to separate temporary capital flows from fundamental market infrastructure.
Market Vulnerabilities
- Arbitrage Reliance: A large percentage of the inflows seen over the past year were driven by delta-neutral basis trades rather than directional accumulation. This makes ETF fund flows highly sensitive to futures funding rates.
- Macro Vulnerability: Bitcoin’s correlation with the S&P 500 and high-beta tech assets spikes during hawkish macroeconomic phases, cutting into its utility as an independent portfolio diversifier.
- Whale Cost Basis Overhead: The massive volume of tokens accumulated between $62,000 and $65,000 creates a heavy resistance zone that will require a major catalyst to break.
Core Strengths
- Structural Wrapper Resiliency: The spot ETF structure is functioning exactly as designed. Redemptions are being handled smoothly without disrupting underlying spot exchange liquidity or causing decoupling events.
- Market Cleansing: The sharp decline in open interest flushes out over-leveraged long positions, setting up a healthier foundation for price discovery once macro pressures ease.
- Institutional Infrastructure Capital: While short-term capital is rotating out, the custody, settlement, and regulatory frameworks built around digital assets by major global banks remain completely intact.
The Path Forward for Investors
For allocators assessing the market, the near-term focus remains firmly on macro indicators. Until U.S. CPI trends downward or the Federal Reserve shifts back to a neutral policy stance, spot demand via ETFs is likely to remain muted.
Traders should carefully watch the $58,700 to $60,000 liquidity zone. If prediction market probabilities shift further toward a sub-$60k drop, it could trigger a final capitulation event for newer whale wallets, clearing the way for a deeper value reset before long-term accumulation resumes.
FAQ SECTION
– Why are spot Bitcoin ETFs seeing such heavy outflows right now?
- The primary driver of these outflows is a shift in macroeconomic policy and interest rate sentiment. As the Federal Reserve signals higher-for-longer interest rates and U.S. Treasury yields rise, institutional investors are cutting back on non-yielding risk assets like Bitcoin. Additionally, hedge funds are unwinding the popular spot-versus-futures basis trade as funding premiums decline, leading to redemptions of their spot ETF holdings.
– How do prediction markets like Polymarket and Kalshi influence Bitcoin’s price?
- Prediction markets function as leading indicators of market sentiment by forcing traders to back their price projections with capital. When platforms like Polymarket and Kalshi show a 62% to 83% probability of Bitcoin breaking below $60,000, spot market makers and liquidity providers take notice. They often lower their buy orders on spot exchanges to manage risk, which reduces short-term price support.
– What is the significance of the $60,000 price level for Bitcoin?
- The $60,000 level is a critical psychological support zone and aligns closely with the average cost basis of newer whale wallets (addresses active for less than six months). A clean break below this level could trigger stop-loss liquidations and forced selling from these large holders, accelerating a deeper market correction.
– What is the difference between open interest and spot ETF flows?
- Spot ETF flows measure the net inflow or outflow of capital into regulated funds holding physical Bitcoin. Open interest tracks the total number of outstanding derivatives contracts (futures and options) that have not yet been settled. Heavy ETF outflows paired with falling open interest show that both spot buyers and leveraged derivatives traders are exiting the market simultaneously.
– Are these outflows a sign that the institutional crypto thesis has failed?
- No. The current outflows reflect standard institutional risk management and macroeconomic capital rotation. The underlying ETF infrastructure continues to handle billions of dollars in redemptions smoothly without causing structural disruptions, proving that the regulated product wrapper is stable and mature.
FINANCIAL DISCLAIMER
This article is provided for informational and analytical purposes only. It does not constitute financial, investment, legal, or tax advice. Digital assets are subject to extreme market volatility and structural risks. Past performance is not indicative of future results. Consult a qualified professional before making any financial allocation decisions.