The Beginner’s Guide to Crypto Candlestick Patterns: Read Market Psychology Like a Pro
The digital asset market can feel like an unpredictable wall of noise. Prices fluctuate wildly across thousands of volatile tokens, driven by a non-stop, global trading cycle. Yet, beneath this apparent chaos lies a structured battleground between two primal forces: buyers (bulls) and sellers (bears).
To interpret who is winning this struggle in real time, institutional desks do not rely on raw intuition. Instead, they look to technical analysis, starting with The Beginner’s Guide to Crypto Candlestick Patterns.
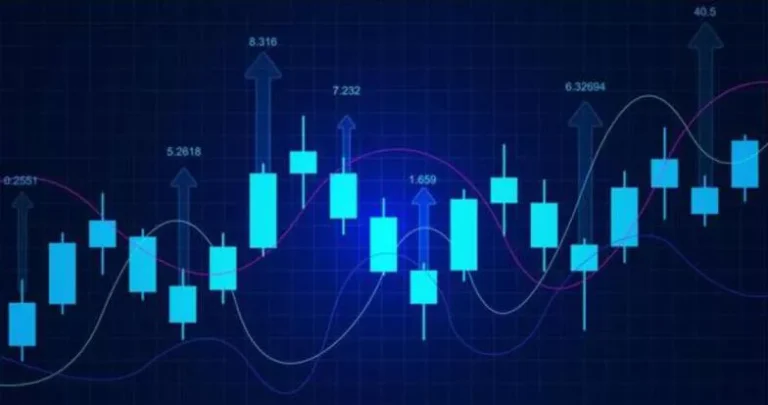
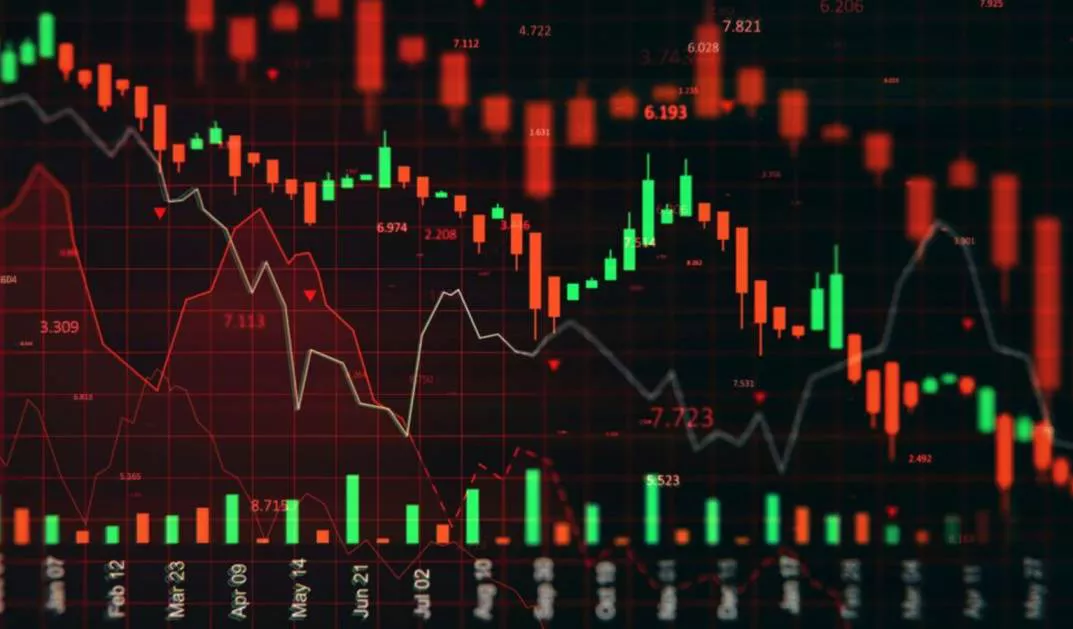
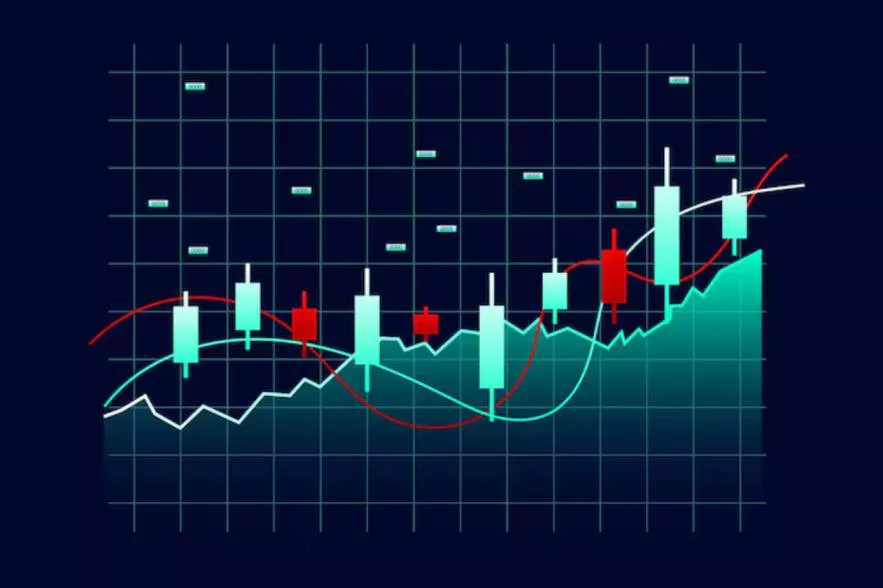
Candlestick charts serve as the foundational language of crypto trading. Invented by 18th-century Japanese rice traders to track asset momentum, these visual structures map out raw price actions across specific intervals. More importantly, they provide an unvarnished window into market psychology.
By understanding how to decode a candle’s structure, its wicks, and its combinations, you transition from gambling on price fluctuations to tracking structural liquidity shifts.
The Anatomy of a Crypto Candlestick: Decoding the OHLC Framework
Before identifying complex patterns, you must understand a single candlestick’s structural mechanics. Every candle provides a visual summary of price behavior over a explicit timeframe—whether that is 1 minute, 4 hours, or 1 day.
This summary relies on four data points known as the OHLC framework: Open, High, Low, and Close.
- Open: The market price of the cryptocurrency when the selected timeframe begins.
- High: The absolute highest price point achieved during that candle’s duration.
- Low: The absolute lowest price point reached during that same interval.
- Close: The final market price of the asset when the timeframe concludes.
The thick, solid portion of the structure is called the real body. The color of this body tells you the directional outcome of that session.
A green (or white) candle means the closing price exceeded the opening price, signaling a bullish victory. A red (or black) candle shows the closing price dropped below the opening price, signaling a bearish takeover.
Extending from the top and bottom of the real body are thin lines known as wicks or shadows. These wicks represent the price extremes rejected by the market during the session.
A long upper wick indicates that buyers attempted to push prices higher, but faced a surge of supply that drove the price back down before the session closed. Conversely, a long lower wick shows that sellers drove the market downward, but aggressive buy orders absorbed the selling pressure, forcing the price back up.
Reversal Powerhouses: Tracking Shifts in Market Sentiment
When individual candlesticks form consecutive sequences, they create recognizable structures. The most critical formations for beginners are reversal patterns, which signal that an existing trend is exhausting its momentum and is poised to change direction.
1. The Doji: Peak Indecision
A Doji candle forms when a cryptocurrency’s opening price and closing price are almost identical. Visually, a Doji resembles a cross or a plus sign because its real body is reduced to a thin horizontal line.
A Doji represents a complete stalemate. Buyers and sellers fought for control throughout the session, but neither could secure an advantage.
While a Doji in isolation is neutral, its placement matters. If a Doji prints after a sustained, multi-week rally, it signals that the buying momentum is stalling. It suggests that demand is drying up, leaving the market vulnerable to a trend reversal.
2. The Hammer and the Shooting Star: Rejection Structures
The Hammer is a single-candle bullish reversal indicator that forms at the bottom of a downward trend. It is characterized by a small real body near the top of the candle and a long lower wick that is at least twice the length of the body, with little to no upper wick.
The psychology of a Hammer is simple: during the session, bears dumped the asset aggressively, creating panic selling. However, institutional buyers stepped in at the lows, absorbing the sell walls and driving the price right back toward the opening level. This creates a powerful signal that a macro price floor may be forming.
The Shooting Star is the exact inverse of a Hammer. It forms at the top of an upward trend, featuring a small real body at the lower end and a long upper wick extending upward. This structure shows a firm rejection of higher prices, signaling that the bulls have run out of steam and sellers are taking control.
3. The Engulfing Structure: Momentum Takeovers
Engulfing structures are multi-candle patterns where a sudden influx of volume completely overrides the previous session’s price action.
- Bullish Engulfing: This two-candle pattern occurs during a downtrend. The first candle is a small red body. The second candle is a large green body that completely covers or “engulfs” the entire range of the previous day’s body. It signals that buyers have aggressively entered the market, overpowering the remaining sellers.
- Bearish Engulfing: Occurring at the peak of an uptrend, this structure features a small green candle completely swallowed up by a subsequent large red candle. It indicates that supply has flooded the market, completely erasing the previous day’s gains and signaling an impending downtrend.
The Core Differences: Crypto vs. Traditional Markets
While standard technical analysis books focus heavily on traditional stocks, applying those rules directly to digital assets without modification can lead to costly errors. The underlying architecture of the crypto market creates unique conditions that affect how candlestick patterns play out.
| Market Characteristic | Traditional Equities (Stocks) | Cryptocurrency Markets |
| Trading Hours | Structured (e.g., 9:30 AM – 4:00 PM EST) | Perpetual (24/7/365, no breaks) |
| Opening/Closing Gaps | Frequent (due to overnight news) | Rare (except on CME futures derivatives) |
| Liquidity Distribution | Centralized on major regulated exchanges | Fragmented across global DEXs and CEXs |
| Leverage Dynamics | Controlled margin requirements | High retail leverage and systemic liquidations |
Because crypto operates continuously without a closing bell, the “daily close” on a chart is largely arbitrary, based on UTC time. This structural difference means that traditional price gaps—where a stock opens significantly higher or lower than its previous close—are rare in crypto spot markets.
Instead of opening gaps, crypto charts show sharp price movements through wick extensions. These long wicks are often triggered by derivative liquidation cascades rather than organic shifts in spot market demand.
When over-leveraged long positions are forced to close automatically on derivatives exchanges, it creates a rapid chain reaction of selling that drives prices down in seconds, leaving a long lower wick behind when spot buyers step back in.
Advanced Validation: Confirming Candlesticks with Market Context
A common mistake among retail traders is treating candlestick shapes as standalone instructions to buy or sell. A Hammer pattern forming in the middle of a choppy, low-volume trading range has very little predictive value.
To filter out these false moves, you must learn to validate your candlestick signals using three core market pillars: volume, key structural levels, and on-chain intelligence.
1. Volume Confirmation
Volume acts as the fuel behind any structural breakout. If a bullish engulfing pattern forms on thin, below-average trading volume, it indicates a lack of conviction from major market participants. It suggests that the price move was simply a low-liquidity squeeze rather than a sustainable trend reversal.
Always look for reversal candles that print alongside a significant volume spike relative to the past 20 sessions. This surge confirms that institutional capital is actively backing the structural shift.
2. Confluence with Support and Resistance
Candlestick patterns require context, meaning they need to form at logical price areas on the chart.
- Support Levels: Historical price floors where buying interest has consistently stepped in to halt downward moves.
- Resistance Levels: Price ceilings where selling pressure has historically capped upward advances.
A Doji or Hammer carries weight when it forms exactly at a multi-month support line or a major psychological round number (such as Bitcoin at $60,000 or Ethereum at $3,000). If the pattern prints in no-man’s-land—meaning deep within the middle of a well-defined trading range—you should generally disregard the signal.
3. Incorporating On-Chain and Derivatives Data
In crypto, you can cross-reference your technical chart patterns with real-time blockchain analytics to gain a clearer picture of market activity. Data from analytics platforms like CryptoQuant and Glassnode can help verify whether a chart pattern aligns with broader on-chain trends.
Pro Tip: Spotting Smart Money Accumulation
When you spot a series of bullish Hammer patterns forming at a key support level, check the Exchange Stablecoin Reserves on CryptoQuant. If stablecoin reserves are rising while BTC exchange balances drop, it indicates that institutional capital is moving funds into position to buy the asset. This on-chain setup confirms that the bullish chart pattern is supported by real capital accumulation rather than temporary retail speculation.
Risk Analysis: The Limitations of Pattern Trading
Technical patterns provide probabilistic frameworks for navigating market trends; they do not offer absolute certainty. Relying entirely on chart formations without a clear risk management strategy can quickly deplete your trading capital.
Pros & Cons of Crypto Candlestick Analysis
- Pros:
- Provides a clear, real-time visual representation of market fear and greed.
- Applicable across multiple asset classes and timeframes, from scalping to macro investing.
- Clearly defines entry and exit zones based on clear structural boundaries.
- Cons:
- Frequent “Fakeouts” where a pattern triggers a breakout before reversing sharply.
- Vulnerable to targeted liquidity hunts, where large market participants intentionally drive prices past common support levels to trigger retail stop-losses.
- Subjective interpretation can lead traders to see configurations that do not exist.
Implementing Technical Protections
To survive long-term in the crypto markets, you must manage your risk on every trade. Never risk more than 1% to 2% of your total trading capital on a single setup.
When trading a bullish pattern like a Hammer, your stop-loss should be placed slightly below the absolute low of the candle’s wick. If the asset’s price drops past that point, it invalidates your structural thesis, signaling that it is time to cut your losses and re-evaluate the market.
FAQ SECTION
– What is the single most reliable crypto candlestick pattern?
- No candlestick pattern is entirely reliable on its own. However, multi-candle structures like the Bullish Engulfing and Morning Star generally offer higher probability signals than single-candle formations. Their reliability improves significantly when they form at long-term support levels and are accompanied by an above-average spike in trading volume.
– Why do candlestick patterns fail so often in crypto compared to stocks?
- Crypto markets feature lower structural liquidity across many smaller tokens, making them susceptible to price manipulation by large holders, often called “whales.” Additionally, the high amount of leverage used in crypto derivatives markets can lead to rapid liquidation cascades. These liquidations often trigger sharp price spikes that override standard technical structures, creating erratic price movements rarely seen in traditional stock markets.
– Which timeframe is best for analyzing crypto candlestick patterns?
- Higher timeframes, such as the 4-hour (4H) and daily (1D) charts, offer more reliable technical signals because they filter out the short-term market noise common on lower timeframes. While lower intervals like the 5-minute or 15-minute charts can be useful for timing entries, they produce a higher number of false signals due to intra-day price volatility.
– Does the color of a Doji candle matter?
- No, the color of a true Doji candle is generally insignificant. The key feature of a Doji is that the opening and closing prices are nearly equal, creating a very thin real body. This structure signals an even balance and indecision between buyers and sellers, regardless of whether the candle finishes slightly green or red.
– How do I know if a candlestick pattern breakout is real or fake?
- To identify fake breakouts, look for volume confirmation and monitor subsequent price action. A valid breakout should occur on high trading volume and be followed by a candle that closes cleanly outside the established support or resistance level. If the price breaks a key level on low volume and quickly reverses back into its previous range, it is highly likely a false breakout.
FINANCIAL DISCLAIMER
Disclaimer: This article is provided for educational and informational purposes only. It should not be construed as professional financial, investment, or trading advice. Cryptocurrencies are highly volatile assets that carry a significant risk of capital loss. Technical analysis and chart patterns do not guarantee future market outcomes. Always conduct your own thorough research, employ strict risk management practices, and consult a certified financial advisor before committing capital to digital assets.