Order Book Depth and Cumulative Volume Delta (CVD): Spotting Institutional Spot Absorption
Evaluating raw price candles is an incomplete approach to modern cryptocurrency markets. Price is simply the historical sequence of matched orders, completely stripped of the underlying supply and demand dynamics that generated those matches. To understand where high-net-worth market participants are risking capital, you must evaluate the mechanics of the Central Limit Order Book (CLOB).
By weaponizing Order Book Depth and Cumulative Volume Delta (CVD): Spotting Institutional Spot Absorption, advanced proprietary traders can peer directly into execution mechanics. This approach helps identify exactly when aggressive retail market-order flows are running headfirst into massive institutional limit-order capital pools. This cross-temporal synthesis of high-frequency transactional data represents the bedrock of modern microstructural technical analysis (Microstructure TA).
1. Deconstructing the Foundations: Order Book Depth and the CVD Engine
To track institutional intent, we must first map the interactions inside the Central Limit Order Book. The order book is a dual-sided structural queue composed of passive limit orders: the bid side represents standing buy intent, and the ask side represents standing sell intent (Cheng, 2026).
The Limit Order Book (LOB) Architecture
Order book depth measures the aggregate volume of resting limit orders resting at progressive price ticks away from the current mid-price. This passive liquidity acts as a structural buffer against large trades.
$$Mid\text{-}Price = \frac{Best\ Ask + Best\ Bid}{2}$$
When an institution executes a passive accumulation strategy, they do not slam market orders into the book, which incurs devastating execution costs. Instead, they position structural blocks of resting limit orders across deep bid levels, waiting for aggressive market orders to fill them.
The Cumulative Volume Delta (CVD) Formula
While order book depth tracks passive intent, Cumulative Volume Delta (CVD) measures aggressive execution. Volume Delta ($\Delta V$) is calculated for every discrete trade by isolating the aggressor side of the transaction:
$$\Delta V = V_{Aggressive\ Buyers} – V_{Aggressive\ Sellers}$$
CVD is the running aggregate sum of these individual delta values over a specified time horizon:
$$CVD_t = \sum_{i=1}^{t} \Delta V_i$$
- Aggressive Buyers: Market participants who submit market buy orders or marketable limit orders, crossing the bid-ask spread to fill resting ask limit orders immediately. This pushes the delta positive.
- Aggressive Sellers: Market participants who submit market sell orders, crossing the spread to execute against resting bid limit orders. This pushes the delta negative.
       [ASK BOOK]   - $70,200 (15 BTC Limit Ask)
                    - $70,150 (10 BTC Limit Ask)
  --------------------------------------------------  <- Spread
       [BID BOOK]   - $70,100 (45 BTC Institutional Limit Bid) <- ABSORPTION ZONE
                    - $70,050 (12 BTC Limit Bid)
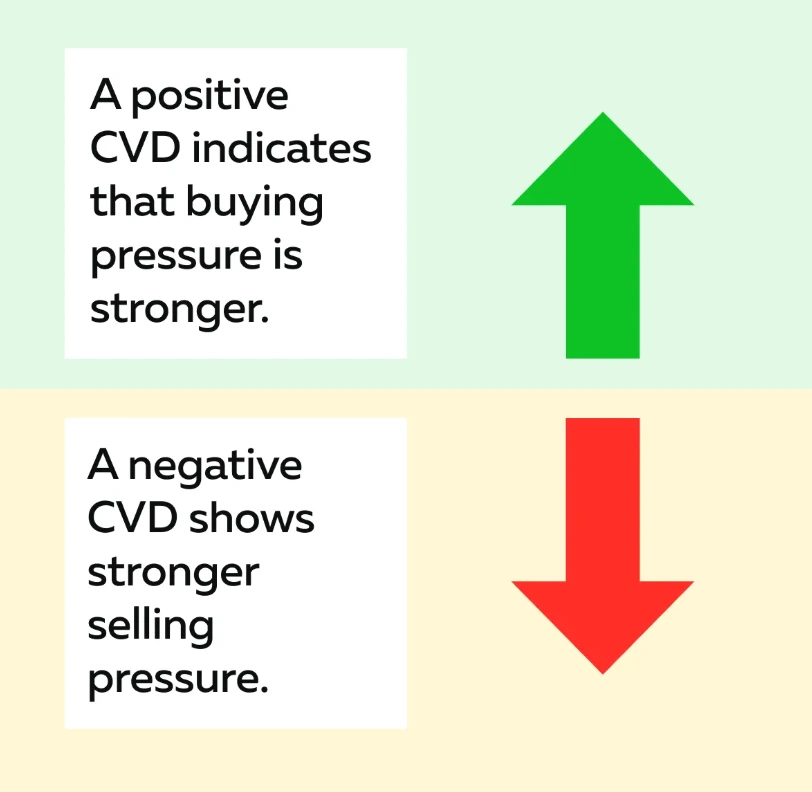
By continuously plotting CVD alongside price, traders can determine whether aggressive buyers or aggressive sellers are driving the immediate market direction.
2. The Mechanics of Spotting Institutional Spot Absorption
The most misconstrued phenomenon in order flow analytics is the concept of market absorption. Retail traders frequently look at a crashing CVD chart and assume an asset is poised to collapse. In doing so, they completely ignore the structural environment provided by passive liquidity layers (Angerer et al., 2025).
What is Spot Absorption?
Spot absorption occurs when institutional market participants deploy massive blocks of passive limit orders to entirely consume aggressive market-order selling without allowing the clearing price to decline.
Aggressive Retail Selling  ======>  [Institutional Limit Bids]  ======>  Price Stabilizes
(Market Orders / CVD Drops)         (High Order Book Depth)              (Floor Formed)
During periods of heavy market stress, panic-driven retail traders market-sell their holdings. This creates an enormous downward spike in aggressive volume, causing the CVD line to plummet. However, if an institution has determined a specific price zone represents an attractive long-term entry point, they will stack the order book depth at that level.
As the retail market orders hit these deep limit bids, the sell pressure is completely neutralized. The market orders are filled, but the price stops dropping.
Identifying the Footprint of Passive Absorption
To confirm institutional absorption rather than a weak, collapsing market, look for the following microstructural footprint:
- CVD Subsidies: The CVD line hits new local or session lows, confirming relentless aggressive market-order selling.
- Price Stagnation: The spot price forms a horizontal, highly stable structural floor, refusing to break lower despite the aggressive selling volume.
- Order Book Replenishment: Real-time level-2 order book tracking reveals that as bids are executed, they are immediately replenished by algorithmic market-making logic or iceberged orders, maintaining deep order book depth at the price floor.
This footprint shows that smart money is actively absorbing the market liquidity supplied by capitulating retail participants.
3. Advanced Microstructure TA: Spot vs. Derivatives CVD Divergences
The introduction of highly levered perpetual swaps and futures contracts has structurally fragmented cryptocurrency price discovery. To find true institutional behavior, a trader must run a comparative analysis using Spot vs. Derivatives CVD Divergences.
Institutional funds and systemic asset allocators primarily operate in physical spot markets to accumulate assets for long-term storage or structured yield generation. Conversely, speculative retail traders, high-leverage momentum funds, and retail hedgers predominantly populate derivatives venues.
| Microstructural Metric | Spot Market Footprint | Derivatives Market Footprint |
| Primary Instruments | Physical Spot Tokens (BTC, ETH) | Perpetual Swaps, Dated Futures |
| Participant Profile | Institutions, Long-Term Allocators | Speculators, Momentum Traders, Leveraged Retail |
| CVD Core Signal | True structural asset accumulation/distribution | Leveraged momentum chasing and liquidations |
| Order Book Profile | Heavy institutional blocks, lower structural velocity | Highly dynamic, algorithmic, tick-dependent depth |
By plotting the Spot CVD line against the Derivatives CVD line, we can uncover powerful market divergences that signal major structural turning points.
The Bullish Absorption Divergence
This structural setup occurs when derivatives traders aggressively short an asset, driving the Derivatives CVD downward, while institutional spot buyers actively absorb the selling.
- Price Action: Consolidating or grinding slowly upward.
- Derivatives CVD: Plummeting violently to new local lows.
- Spot CVD: Flattening out or actively rising.
Microstructural Insight: This divergence reveals that speculative short sellers are hitting a structural brick wall of institutional spot buying. Because spot accumulation does not introduce funding fee liabilities or liquidation thresholds, the spot buyers can hold this floor indefinitely.
Eventually, the derivatives short-sellers exhaust their margin capacity, forcing a violent short squeeze as they buy back contracts into a thin ask book.
The Bearish Distribution Divergence
The exact inverse occurs when retail traders chase a breakout using high-leverage derivatives contracts, while institutions use the surging liquidity to dump spot positions.
- Price Action: Ranging horizontally at a local high.
- Derivatives CVD: Surging sharply upwards to new highs.
- Spot CVD: Trending downward or declining sharply.
Microstructural Insight: Retail is market-buying the top using leverage, while institutional spot players are passively filling those orders via limit sell walls. Once the retail buying momentum stalls, the lack of real spot backing causes the price to roll over, triggering a cascading liquidation event across the over-leveraged derivatives books.
4. Measuring Market Resiliency: Bid-Ask Spread Elasticity and Slippage Indices
To fully exploit spot absorption setups, you must quantify how elastic the order book is under real-world transaction stress. This requires analyzing Bid-Ask Spread Elasticity and tracking custom Slippage Indices.
Understanding Bid-Ask Spread Elasticity
The quoted bid-ask spread is not a static number; it behaves like a dynamic rubber band. Spread elasticity measures the speed at which the bid-ask spread returns to its baseline equilibrium state after a massive market order completely depletes the immediate top-of-book liquidity (Varma, 2026).
$$\text{Spread Elasticity} = \frac{\Delta \text{Spread}_{t_0 \to t_1}}{\text{Recovery Time}}$$
When a market order executes against the top of the book, the spread instantly widens:
Baseline Spread:  Bid $70,100 | Ask $70,101  (Spread: $1)
Large Market Buy hits Ask Book...
Widened Spread:   Bid $70,100 | Ask $70,115  (Spread: $15)
In a highly elastic, institutionally backed market, algorithmic market makers and passive inventory allocators step in within milliseconds, quoting new limit orders to tighten the spread back to its baseline range. In an inelastic market, the spread remains wide for seconds or even minutes, revealing an adverse selection environment where liquidity providers are terrified of being run over by toxic order flow (Angerer et al., 2025).
Constructing Market-Specific Slippage Indices
A professional trading desk does not rely on exchange-reported liquidity metrics. Instead, they construct real-time Slippage Indices to evaluate the true financial friction of executing size.
A standard Slippage Index ($SI$) quantifies the dollar value or token volume required to systematically displace the mid-price by a fixed basis-point threshold (e.g., 50 bps):
$$SI_{50} = \int_{Mid}^{Mid \times 1.005} Depth_{Ask}(p) \, dp$$
Monitoring structural changes in your Slippage Indices allows you to spot institutional positioning before it shows up on a standard price chart:
- Slippage Index Expansion: The volume required to move the price upward increases dramatically, while the volume required to move it downward decreases. This indicates institutional limit orders are building heavy overhead supply walls (Distribution).
- Slippage Index Compression: The asset becomes highly resistant to downward market orders, requiring massive, anomalous sell volume to move the price down even 10 basis points. This confirms that the order book depth is heavily fortified by passive spot absorption algorithms.
5. Strategic Macro-Micro Integration: Order Flow in the 2026 Liquidity Paradigm
Order flow analysis does not happen in a vacuum. To build high-probability structural trading setups, microstructural order book analytics must be paired directly with macro liquidity modeling.
Macro Liquidity Regimes and Microstructural Resiliency
The structural depth of central limit order books across top-tier crypto asset venues is directly tied to the macro liquidity injections controlled by global central banks (the Federal Reserve, ECB, and PBOC).
- Quantitative Tightening / Contractive Liquidity Regimes: When the Federal Reserve drains dollar liquidity from the banking system or maintains restrictive interest rate frameworks, commercial market-making firms (such as Wintermute, GSR, and Jump Trading) systematically de-risk their positions. They pull depth away from the central limit order book, leading to wide bid-ask spreads, low elasticity, and high slippage profiles across all pairs. In this environment, spot absorption patterns are rare and easily broken.
- Quantitative Easing / Expansive Liquidity Regimes: When macro liquidity expands, market-making desks access low-cost capital, allowing them to tighten bid-ask spreads and stack deep limit orders across the book. This structural backing creates highly resilient absorption floors that reliably catch cascading retail liquidation events.
Incorporating Structural Cross-Temporal Modeling
To successfully trade these setups, map your order book indicators across multiple horizons (Kuznetsov, 2025):
+-------------------------------------------------------------+
|                     MACRO MOMENTUM LAYER                    |
|             Tracks Global Liquidity Cycles & Fed Policy     |
+-------------------------------------------------------------+
                              |
                              v
+-------------------------------------------------------------+
|                  MICROSTRUCTURE TA LAYER                    |
|    Monitors Spot vs. Deriv CVD Divergences & Book Elasticity |
+-------------------------------------------------------------+
By aligning short-term order book dynamics with the broader macro trend, you ensure that you are trading alongside institutional market participants rather than stepping in front of an unabsorbed market cascade.
6. Institutional Order Flow Analysis: Mechanics vs. Realities
To build an edge using order flow metrics, you must balance theoretical market microstructure theory with the realities of live crypto trading venues.
Structural Advantages of Microstructural Tracking
- Elimination of Lag: Unlike moving averages or momentum oscillators that rely on past closing prices, order book tracking evaluates orders that are currently waiting to be filled or trades that have just executed. This provides an unlagged look at market supply and demand.
- Direct Intent Tracking: Spot vs. derivatives CVD analysis explicitly separates speculative leverage from physical spot accumulation, letting you align your portfolio with long-term institutional capital.
- Precise Risk Management: Spotting an institutional spot absorption floor gives you a clear, structural invalidation level to place stop-loss orders directly beneath.
Technical Limitations and Real-World Structural Risks
- Order Book Spoofing: High-frequency algorithmic systems routinely display massive limit orders to deceive other market participants, only to cancel them milliseconds before execution. Relying on raw order book depth without validating whether those orders get filled can expose a trader to toxic spoofing strategies.
- Fragmentation Frictions: Crypto liquidity is highly fragmented across multiple centralized venues (Binance, Coinbase, OKX) and decentralized AMM pools. A CVD divergence on one venue can easily be negated by a massive, hidden block order clearing on an alternative exchange.
- Adverse Selection Hazards: Standing in front of a cascading market to play an absorption bounce carries high risk. If a negative infrastructure shock or regulatory enforcement action hits the market, institutional buyers will pull their bids instantly, turning a expected absorption floor into an unbacked liquidity black hole (Farzulla, 2025).
7. Operationalizing the Blueprint: The Structural Setup Checklist
To turn this microstructural analysis into an executable system, trade setups should be filtered through a strict, multi-step validation flow.
Step-by-Step Order Flow Execution Blueprint
[1. Spot Floor Identified] ──> [2. CVD Divergence Confirmed] ──> [3. Elasticity Checked] ──> [4. Trade Execution]
- Identify the Spot Infrastructure Floor: Locate a key structural support zone on the daily or 4-hour spot chart where institutional accumulation has historically manifested.
- Confirm the CVD Divergence Profile: Wait for price to revisit this zone during a retail panic cascade. Verify that the Derivatives CVD is printing deep lower-lows while the Spot CVD holds flat or trends upward.
- Evaluate Bid-Ask Spread Elasticity: Monitor the order book immediately after a large sell block hits the bids. Ensure the spread recovers within milliseconds, confirming active, resilient institutional market-making.
- Measure the Slippage Index: Ensure the custom Slippage Index ($SI_{50}$) shows significant clustering on the bid side, requiring highly anomalous sell volume to break the support level.
- Execute with Structural Invalidation: Enter a long position within the absorption zone. Place the stop-loss order structurally below the final layer of resting institutional limit bids. If those deep blocks are fully cleared, the absorption thesis is structurally invalidated, and the trade must be cut immediately.
FAQ SECTION
– What is the primary difference between a volume-weighted oscillator and Cumulative Volume Delta (CVD)?
- Standard volume oscillators simply weigh total transaction volume against price changes over a given time interval. CVD operates on a granular microstructural level by evaluating trade prints tick-by-tick, isolating whether the buyer or seller was the aggressive aggressor who crossed the bid-ask spread. This makes CVD a precise tool for tracking market order aggression rather than generic volume.
– How can a trader protect themselves from order book spoofing when analyzing order book depth?
- To protect against spoofing, you should avoid looking at resting order book depth as a static metric. Instead, pair it with a real-time execution feed or a footprint chart. Only trust deep limit orders if they actively absorb volume when tested by market orders, or if they hold their position as the mid-price approaches them. If a large bid block disappears right before price touches it, it was a spoof order designed to create fake demand.
– Why does spot CVD divergence carry more analytical weight than derivatives CVD divergence?
- Spot CVD reflects structural capital allocation—market participants buying asset inventory outright to hold it for the long term. Derivatives CVD, on the other hand, is heavily influenced by short-term traders using high leverage, hedging strategies, or momentum-chasing positions. When spot CVD diverges from derivatives CVD, it shows a clear split between institutional buyers and short-term speculators, with institutional capital historically dictating the long-term trend.
– What does a sudden widening of the bid-ask spread during an absorption phase indicate?
- If the bid-ask spread widens significantly and stays wide, it indicates a high risk of adverse selection. This means market makers and large institutional buyers are pulling their passive limit orders out of the book because they expect a severe price decline. True institutional spot absorption requires a tight, highly elastic bid-ask spread that recovers quickly from large trades, showing that buyers are eager to accumulate inventory at that price level.
FINANCIAL DISCLAIMER
Financial Disclaimer: This analysis is provided strictly for educational and informational purposes and does not constitute financial, investment, or trading advice. Cryptocurrencies, digital assets, and derivatives instruments carry extreme volatility and structural market risks. Market microstructure indicators, including order book depth and Cumulative Volume Delta (CVD), are subject to rapid change, algorithmic manipulation, and fragmentation across trading venues. Past performance and microstructural setups do not guarantee future results. Never risk capital that you cannot afford to lose entirely.