Multi-Timeframe RSI Divergences: Isolating Smart Money Reversals From Volatility Noise
Crypto asset markets are distinct from traditional equity and legacy financial systems due to their systemic leverage, perpetual linear funding-rate dynamics, and fragmented liquidity infrastructure. For retail traders utilizing basic setups, standard indicators like the Relative Strength Index (RSI) frequently trigger false signals. In a strongly trended crypto environment, an asset can remain technically “overbought” or “oversold” for weeks at a time while cascading short squeezes or liquidations wipe out premature counter-trend positions.
To gain a real edge, institutional market participants do not view momentum in isolation. Instead, they look for structural alignment across various horizons. Using Multi-Timeframe RSI Divergences allows sophisticated market participants to isolate true smart money reversals from mere volatility noise. By anchoring these higher-timeframe momentum shifts to structural benchmarks—specifically Volume-Weighted Average Price (VWAP) Deviation—traders can filter out retail traps and enter high-probability, low-risk reversal zones.
1. The Anatomy of Multi-Timeframe Momentum Exhaustion
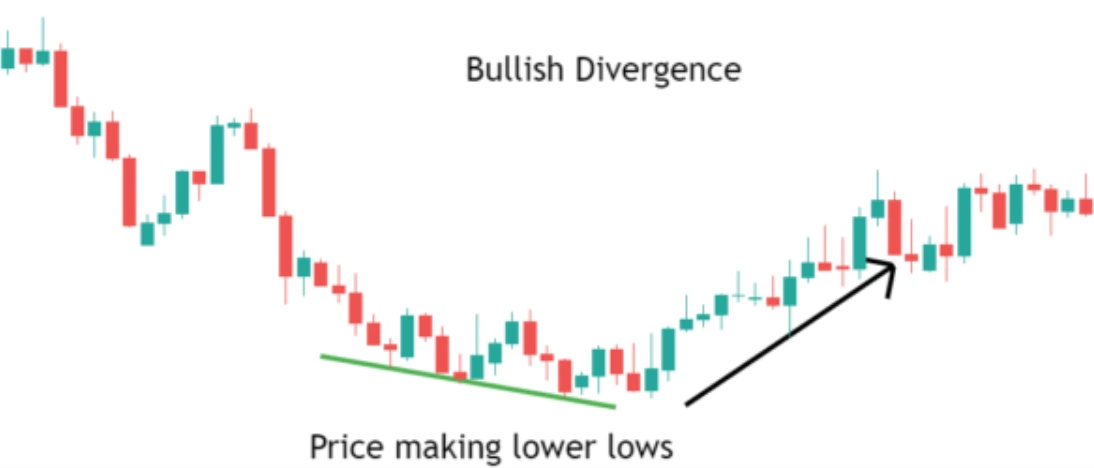
A standard RSI divergence occurs when the underlying asset price prints a structural extreme (a higher high or lower low) that is not validated by the momentum oscillator. This mismatch signals a deceleration in buying or selling velocity. However, inside lower-timeframe distributions (such as 5-minute or 15-minute charts), these signals are often simply artifacts of brief algorithmic stop-runs or order book imbalances.
True smart money accumulation and distribution phases manifest systematically on macro horizons. When tracking Daily/Weekly RSI Divergences, you are observing changes in market participant positioning over several weeks or months.
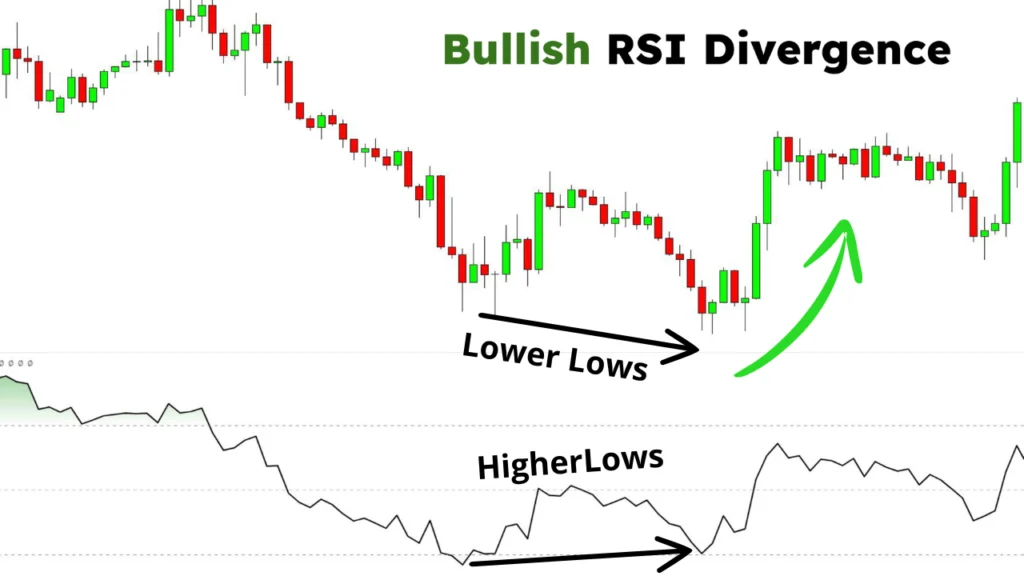
Regular Bullish Divergence
- Price Action: Asset prints a lower low.
- RSI (Daily/Weekly): Indicator prints a higher low.
- Market Mechanics: Aggressive market sellers are exhausting their capital into passive institutional limit orders. Despite the lower price print, the internal velocity of the selling pressure is decelerating sharply.
Regular Bearish Divergence
- Price Action: Asset prints a higher high.
- RSI (Daily/Weekly): Indicator prints a lower high.
- Market Mechanics: Late-stage retail buyers are chasing breakouts into institutional distribution blocks. The upward price movement lacks sustained spot market backing and is heavily driven by over-leveraged derivatives buying.
By mandating that a divergence must print on the Daily or Weekly chart, you instantly filter out approximately 90% of the intraday noise caused by liquidations and market maker hedging. The macro timeframe filters out the erratic noise, revealing where institutional players are building long-term positions.
2. The Anchoring Mechanism: Volume-Weighted Average Price (VWAP) Deviation
Even a clean macro divergence requires an explicit confirmation trigger. Momentum indicators tell you how fast price is moving, but they cannot tell you where liquidity is trapped or when price has stretched too far from its intrinsic value. To solve this, institutional execution desks pair momentum oscillators with Volume-Weighted Average Price (VWAP) Deviation.
VWAP serves as the definitive benchmark for intra-session or multi-day value. By calculating the total dollar volume traded divided by total contracts or coins exchanged, VWAP maps out the true average price paid by market participants.
$$\text{VWAP} = \frac{\sum (\text{Typical Price} \times \text{Volume})}{\sum \text{Volume}}$$
When we apply standard deviation bands to this metric, we create a volatility-adjusted envelope.
The Mathematical Edge of Variance
In a normal distribution model, price action returns to the mean (the baseline VWAP) after expanding outward. In crypto markets, because of tail-risk and high volatility, price regularly hits extreme standard deviations ($\pm2$ to $\pm4$).
When a Daily/Weekly RSI Divergence prints at the exact moment price pierces the outer $\pm3$ standard deviation band of a rolling anchored VWAP, the probability of a sharp mean-reversion move increases significantly. This confluence signals that the asset is both highly overextended relative to its volume-weighted value and experiencing a severe loss of underlying momentum.
3. The Institutional Execution Playbook
To trade these setups effectively, you can follow an institutional execution matrix that starts with a macro trend check and drills down to a micro entry trigger.
Step 1: Macro Discovery
Scan major layer-1 assets, blue-chip DeFi protocols, or liquid derivatives markets for clear structural divergence on Daily and Weekly intervals.
Step 2: Volume Verification
Analyze trading volume alongside the divergence. A healthy smart money reversal features declining volume on the final price thrust that creates the divergence, followed by a surge in volume when the trend reverses. If volume spikes significantly to new highs on the final price thrust, the trend is likely extending, which invalidates the divergence signal.
Step 3: VWAP Envelope Metric
Confirm that the asset’s price has drifted into extreme territory. The price should be trading outside or near the boundaries of the $\pm3$ standard deviation band calculated from a key structural anchor point, such as a swing high, swing low, or major market event.
Step 4: Trigger Execution
Do not market-order immediately upon a macro divergence print. Instead, drop down to a lower interval chart (e.g., 4-hour) and wait for a clear Market Structure Shift (MSS)—such as the displacement and break of the recent swing high or low that led to the divergence. Place your protective stop-loss directly beyond the structural invalidation high or low.
Pro Tip: Look for institutional liquidity sweeps during this process. If price sweeps a prominent swing low to collect sell-stop liquidity and immediately reclaims that level while creating a daily RSI higher low, you have a high-conviction setup. This sequence indicates that large players have filled their buy orders using retail stop-losses.
4. Analytical Comparison: Volatility vs. Smart Money Reversals
Understanding the differences between market noise and genuine institutional accumulation or distribution is critical for avoiding bad entries.
| Metric | Volatility Noise (Retail Trap) | Smart Money Reversal (Institutional) |
| Primary Timeframe | 1-minute to 1-hour | Daily and Weekly charts |
| Volume Profile | Flat or erratic volume expansions | Decreasing volume on final thrust; expansion on reversal |
| VWAP Location | Hovering within the $\pm1$ Standard Deviation | Extended outside $\pm2.5$ or $\pm3$ Standard Deviations |
| Order Book State | Thin liquidity with high slippage | High-volume passive limit fills (Iceberg orders) |
| Funding Rates | Heavily skewed to extremes (Long or Short heavy) | Mean reverting or flattening as leverage flushes out |
5. Systemic Risks, Limitations, and Reality Checks
While combining multi-timeframe RSI divergences with VWAP deviation provides a structural edge, no single technical strategy is completely foolproof in digital asset markets.
The “Divergence Extension” Risk
In macro extensions—such as early-stage parabolic bull runs or systemic crypto credit insolvencies—an asset can print triple, quadruple, or compounding daily RSI divergences. For example, during a severe market capitulation, an asset can drop continuously, forcing the RSI into a series of rising lows that keep failing as the downward trend breaks through support levels.
Tail-Risk and Exchange Liquidation Cascades
When liquidations hit the perpetual swap markets, automated engines clear positions by selling directly into the order book without regard for price or value. These forced liquidations can push prices well past traditional $\pm3$ or $\pm4$ standard deviation bands, ignoring momentum oscillators entirely until the leverage is fully flushed from the system.
Risk Management Protocols
- Hard Stop-Losses: Always place an absolute invalidation line in the market. Never run an unhedged mean-reversion strategy without a hard stop-loss.
- Asymmetric Position Sizing: Reversal setups are inherently counter-trend initially. Allocate lower base capital units compared to trend-continuation setups, targeting high risk-to-reward ratios (minimum 1:3 or 1:4).
- Macro Liquidity Filtering: Cross-reference your technical setups with macro liquidity metrics, such as shifts in stablecoin supplies or net flows into spot ETFs.
6. Strategic Implementation: Building Your Tactical Trading Suite
To turn this analytical framework into an actionable routine, you can integrate these setups directly into your tracking systems:
1. Build a Macro Scanner
Configure your charting software or quantitative alerts to track assets where the 14-period Daily RSI crosses below 30 or above 70, while simultaneously printing an opposing swing structural trend against price.
2. Map Key Anchor Points
Anchor your VWAP calculations to major trend origins rather than just the daily session open. Excellent anchor points include the start of the fiscal quarter, major central bank interest rate announcements, or significant crypto market cycle highs and lows.
3. Maintain Your Trading Journal
Document the precise market conditions behind every trade. Track whether your setups occur during periods of high structural liquidity or low-volume weekends to help refine your execution edge over time.
FAQ SECTION
– What is a multi-timeframe RSI divergence?
- A multi-timeframe RSI divergence occurs when an asset’s price action and its Relative Strength Index (RSI) show conflicting structural signals across multiple intervals, specifically using macro charts (Daily/Weekly) to establish the directional bias and lower timeframes (e.g., 4-Hour) to execute trades.
– How does VWAP deviation help confirm an RSI divergence signal?
- VWAP deviation measures how far price has drifted from its volume-weighted average value. When a daily or weekly RSI divergence forms while price is extended outside the $\pm2.5$ or $\pm3$ standard deviation bands, it confirms that the move is historically overextended and prime for a mean-reversion correction.
– Why do lower-timeframe RSI divergences often fail in crypto trading?
- Lower-timeframe divergences (on 5-minute or 15-minute charts) regularly fail because they are often driven by short-term volatility noise, retail stop-runs, or sudden derivatives liquidations. These moves lack the large-scale institutional accumulation or distribution required to trigger a sustained trend reversal.
– What is the ideal RSI setting for isolating smart money reversals?
- The standard 14-period setting remains highly effective when applied to Daily and Weekly timeframes. Rather than changing the indicator’s core settings, the institutional edge comes from multi-timeframe alignment and combining momentum with volume-weighted structural indicators like VWAP.
– How do you protect your capital if a macro divergence keeps extending?
- To manage risk against extending divergences, you should never enter a trade based solely on an oscillator reading. Always wait for a lower-timeframe Market Structure Shift (MSS)—such as a clear break of a recent swing high or low—to confirm the entry, and place a hard stop-loss just past the invalidation extreme.
FINANCIAL DISCLAIMER
The analysis and insights provided in this publication are for educational and informational purposes only. Digital assets, derivatives, and leveraged trading carry a substantial risk of financial loss and are highly volatile. This content does not constitute financial, investment, or trading advice. Past performance is not indicative of future market results. Always consult with a certified financial professional or perform independent quantitative due diligence before committing capital to live financial markets.