Deconstructing the MVRV Z-Score: Identifying Macro Cycle Tops and Generational Accumulation Zones
Evaluating market extremes in the digital asset ecosystem requires moving past traditional technical indicators like the Relative Strength Index (RSI) or moving average crossovers. Because crypto assets operate on public ledgers, investors have access to an entirely unique vertical of intelligence: on-chain data.
Among the vast array of network metrics, deconstructing the MVRV Z-Score stands out as one of the most reliable methods for identifying macro cycle tops and generational accumulation zones.
By comparing the aggregate market valuation against the actual capital settled into the asset class, this metric filters out short-term speculative noise, providing macro traders with clear signals for cyclical turning points.
1. What is the MVRV Z-Score? The Mathematical Foundation
To understand the utility of the MVRV Z-Score, one must first dissect its underlying components: Market Value (MV) and Realized Value (RV).
- Market Value (Market Cap): The standard metric calculated by multiplying the total circulating supply of an asset by its current market price. This represents the current speculative value of the network.
- Realized Value (Realized Cap): A specialized on-chain metric that values each unspent transaction output (UTXO) based on the price when it last moved. Instead of assuming every coin is worth the current market rate, Realized Cap calculates the aggregate cost basis of the entire network.
The standard MVRV ratio simply divides Market Cap by Realized Cap. However, during hyper-bull markets, exponential price surges distort the baseline ratio. The MVRV Z-Score corrects for this by applying a standard deviation variance to the data.
The Calculation Formula
$$\text{MVRV Z-Score} = \frac{\text{Market Cap} – \text{Realized Cap}}{\text{Standard Deviation (Market Cap)}}$$
By tracking the distance between market value and realized value in terms of standard deviations, the Z-score reveals when price is moving too far ahead of—or lagging behind—the network’s underlying financial foundation.
2. Pinpointing Generational Accumulation Zones (The Green Band)
For long-term allocators, the primary objective is identifying periods of structural capitulation. The MVRV Z-Score achieves this by isolating instances where the market capitalization drops below or approaches parity with the Realized Cap.
Historically, whenever the MVRV Z-Score enters or dips below the 0.0 to 0.1 range (often designated as the green accumulation band), it signals that the market is valuing the asset at or below its aggregate cost basis.
+-----------------------------------------------------------------+
| HISTORICAL ACCUMULATION ZONE METRICS                            |
+----------------------+------------------+-----------------------+
| Cycle Bottom Period  | MVRV Z-Score Min | Months in Green Band  |
+----------------------+------------------+-----------------------+
| 2015 Capitulation    | -0.15            | ~5 Months             |
| 2018 Bear Market     | -0.05            | ~4 Months             |
| 2020 Liquidity Crash |  0.08            | <1 Month              |
| 2022 Crypto Winter   | -0.18            | ~6 Months             |
| 2025/2026 Correction | [INSERT DATA]    | [INSERT DATA]         |
+----------------------+------------------+-----------------------+
When the score drops into this territory, it means the average market participant is holding an unrealized loss. Sellers have completely exhausted their distribution, leaving only high-conviction entities—often referred to as Long-Term Holders (LTHs)—holding the remaining supply.
Pro Tip: Buying an asset when its MVRV Z-Score is below 0.1 does not mean you have caught the absolute price bottom. It means you are entering a position alongside institutional whales at a price level that has historically yielded asymmetric upside over a 12-to-36-month horizon.
3. Identifying Macro Cycle Tops (The Red Danger Zone)
Conversely, speculative frenzies pull the market capitalization rapidly away from the realized foundation. When retail and institutional euphoria hits a peak, buying velocity drives the price exponentially higher, while the realized cap moves slowly because older coins are transferred to new, speculative buyers.
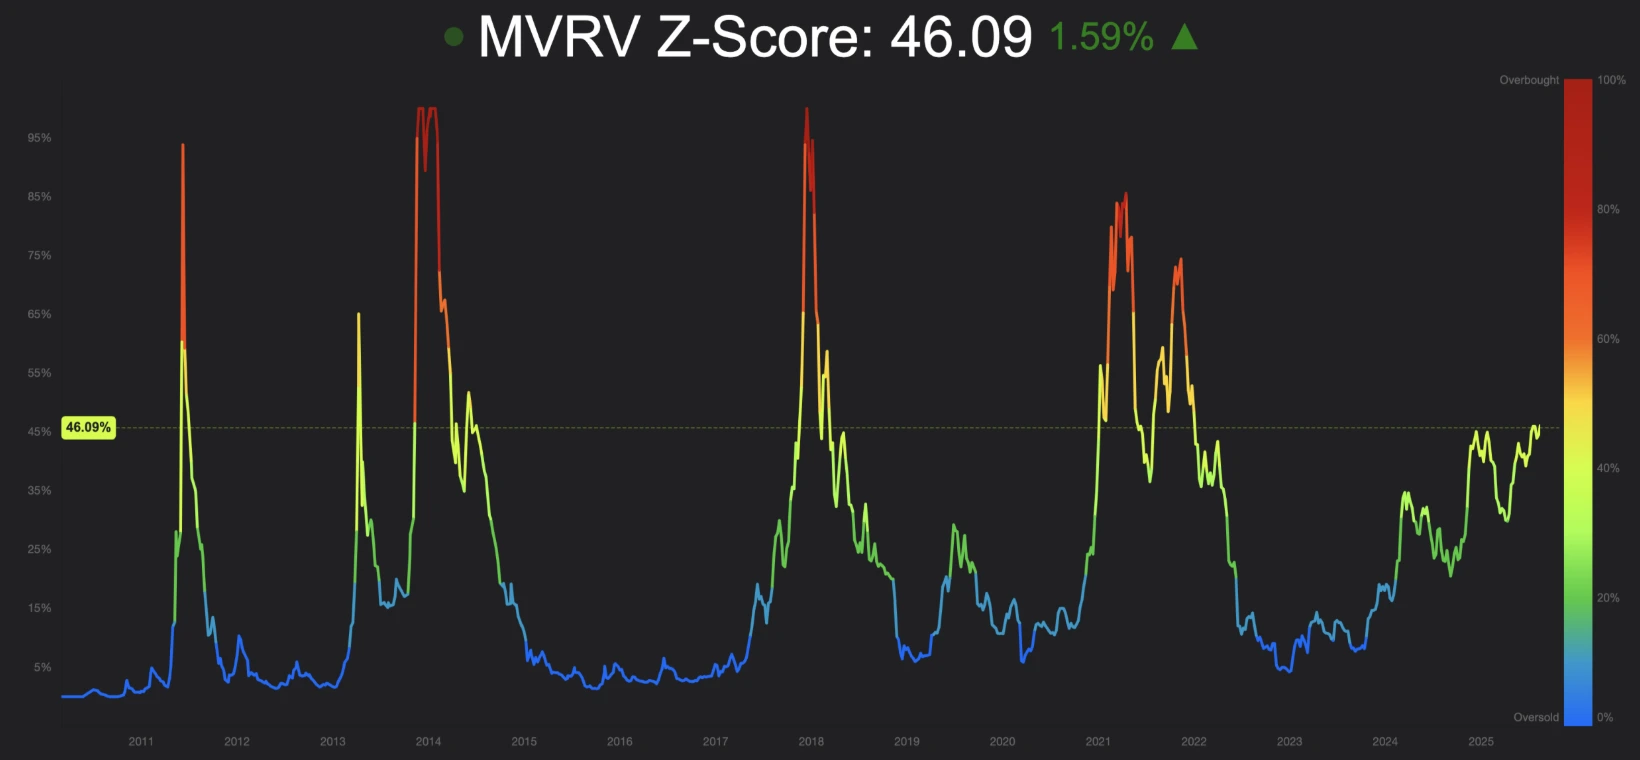
Historically, an MVRV Z-Score scaling above 7.0 to 8.0 signals extreme overvaluation. At these levels, the market value is multiple standard deviations above the network’s true capital baseline, indicating that almost all circulating supply is sitting on immense unrealized profits.
The Phenomenon of Diminishing Variance Peaks
An essential insight for the modern crypto analyst is that the absolute peak of the MVRV Z-Score has diminished with each sequential market cycle:
- 2013 Peak: Z-Score reached over 11.0
- 2017 Peak: Z-Score topped out near 9.0
- 2021 Peak: Z-Score peaked close to 7.0
This structural down-trend is a direct result of asset maturation, deeper liquidity pools, and the dampening of extreme volatility. Analysts attempting to hold out for a Z-score of 9.0 in modern market environments risk missing the cycle top entirely.
4. Integrating Short/Long-Term Holder Cost Basis
To eliminate false signals and refine execution timing within generational accumulation zones, advanced analysts cross-reference the MVRV Z-Score with the Short-Term Holder Cost Basis (STH-CB) and Long-Term Holder Cost Basis (LTH-CB).
The relationship between these cohorts provides the internal engine that drives the Z-score’s movements:
- The Bull Market Fuel: In a healthy macro uptrend, the current market price remains above the STH-CB, which in turn stays well above the LTH-CB. This status quo persists until the MVRV Z-Score pushes into the overvalued territory above 6.0.
- The Structural Capitulation Cross: During transition phases into deep bear markets, the STH-CB drops below the LTH-CB. When this crossover occurs simultaneously with the MVRV Z-Score entering the green accumulation band, it confirms that even recent buyers have completely capitulated, formalizing a generational bottom.
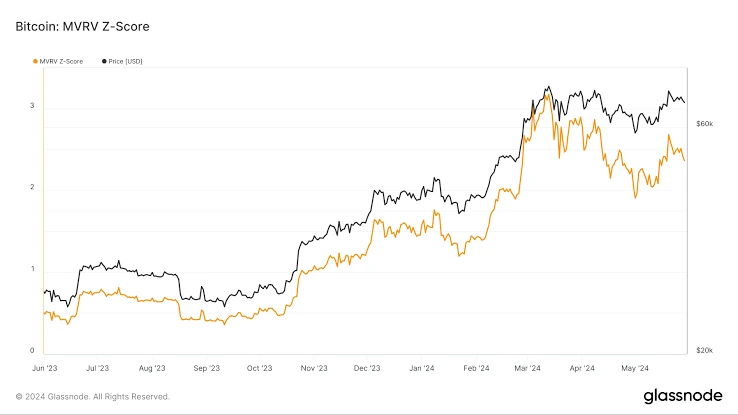
5. Modern Distortions: The Spot ETF and Institutional Custody Factor
The structural landscape of digital asset markets shifted significantly with the widespread adoption of spot ETFs and institutional custody solutions. These financial instruments introduce capital flows that require adjusting how we interpret on-chain metrics.
Institutional Inflow Speed
Historically, realized cap climbed gradually as retail capital trickled through exchanges. Today, institutional blocks move tens of millions of dollars into regulated custodians in singular transaction sets. This dynamic causes the Realized Cap to react faster to price appreciation than it did in previous cycles, which naturally suppresses the MVRV Z-Score from reaching historical extremes.
Lost and Dormant Supply
Millions of early coins are permanently lost or held in deep cold storage by early founders. These coins sit at a near-zero cost basis, permanently dragging down the aggregate Realized Cap. Advanced applications of the MVRV Z-Score adjust for this by filtering out coins that have been inactive for more than 7 years, delivering a more responsive metric for active trading supplies.
6. Comprehensive Risk Analysis: Pros and Cons
While deconstructing the MVRV Z-Score provides significant clarity, no metric should be used in isolation. Successful execution requires balancing its strengths against its technical limitations.
Advantages
- Historically Validated: It has accurately boxed every major macro market top and bottom within digital asset history.
- Objective Value Baseline: It completely removes sentiment, media narratives, and macro fear from the equation by focusing strictly on mathematical capital settlement.
- Excellent Capital Allocator Tool: Provides clear parameters for when to dollar-cost average (DCA) into markets versus when to scale out of risk.
Limitations
- Extended Lag Times: The Z-score can sit in the accumulation or overvaluation zone for months at a time. It is a macro compass, not a micro timing trigger.
- Structural Drift: As institutional infrastructure scales, the asset’s overall volatility drops, meaning historical threshold markers require constant recalibration.
FAQ SECTION
– What is a good MVRV Z-Score for buying?
- Historically, any MVRV Z-Score below 0.1, or into negative values (below 0.0), represents a generational accumulation zone. At these levels, the asset’s total market cap is close to or below its aggregate on-chain cost basis, presenting an asymmetric buying opportunity.
– How does the MVRV Z-Score predict market tops?
- The metric predicts cycle tops by measuring when the market cap extends multiple standard deviations above the realized cap (historically above 7.0). This indicates that the asset’s price has moved unsustainably fast relative to the actual capital invested by holders, signaling an imminent distribution phase.
– What is the difference between the MVRV Ratio and the MVRV Z-Score?
- The standard MVRV ratio simply divides the market capitalization by the realized capitalization. The MVRV Z-Score refines this data by subtracting the realized cap from the market cap and dividing the result by the standard deviation of the market cap, which normalizes the data and makes comparisons across different multi-year cycles more accurate.
– Does the introduction of spot ETFs break the MVRV Z-Score metric?
- It does not break the metric, but it alters its behavior. Large-scale institutional inflows through spot ETFs push the realized cap up more rapidly during rallies. This keeps the MVRV Z-Score lower than it would have been under retail-driven market conditions, requiring analysts to look for cycle peaks at lower absolute Z-score thresholds.
– How often does the MVRV Z-Score update?
- On-chain analytics platforms typically update the metric once per day after parsing the previous 24 hours of blockchain transactions, block reward distributions, and UTXO movements.
FINANCIAL DISCLAIMER
The information provided in this article is for informational and educational purposes only and should not be construed as financial, investment, or trading advice. Digital assets are highly volatile and carry a significant risk of capital loss. On-chain metrics are lagging indicators based on historical data and do not guarantee future market behavior or performance. Consult a qualified financial advisor before making any investment decisions.