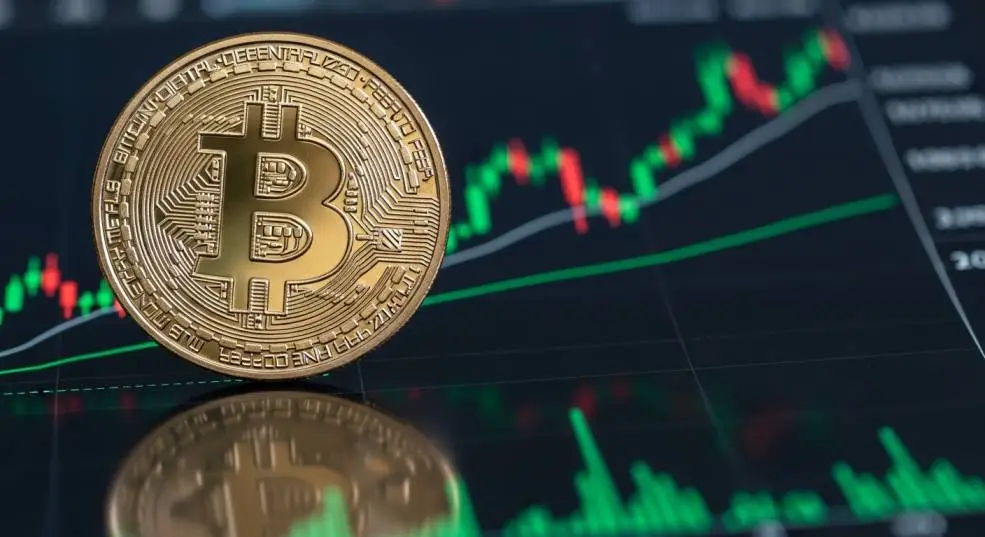
Bitcoin’s $77K Deadlock: Why the 29% Rally Still Lacks Bullish Confirmation
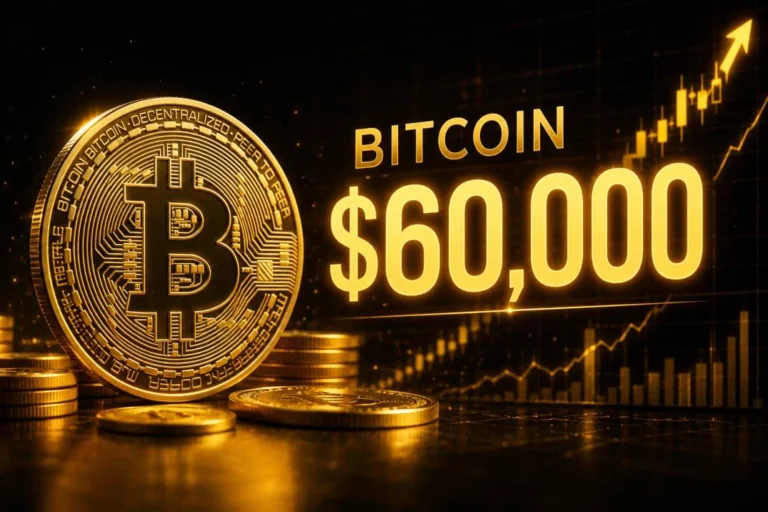
Bitcoin is currently oscillating in a precarious “no-man’s-land.” As of April 29, 2026, the asset is trading between $77,100 and $77,650, reflecting a 29% recovery from the February 5 “Flash Crash” lows of $60,000. Yet, for seasoned traders, this rally feels hollow. Despite the double-digit gains, BTC has failed to secure a weekly close above the 21-week EMA (~$79,000)—the historical arbiter of “True Bull” vs. “Relief Rally.”
The market is currently a coiled spring. Below the surface, a $1.2 billion short-squeeze is brewing, but without a definitive macro catalyst, Bitcoin remains a hostage to its own correlation with traditional risk assets.
1. The Breakout Mirage: Analyzing the 29% Bounce
While a 29% rise sounds like the start of a parabolic move, on-chain data suggests we are seeing a “re-accumulation” phase rather than an impulsive breakout.
- The “Smart Money” Signal: According to Glassnode, the aSOPR (Adjusted Spent Output Profit Ratio) has recently flipped above 1.0. This indicates that participants are finally moving coins at a profit, a necessary psychological shift to support a sustainable floor.
- Exchange Scarcity: CryptoQuant data shows exchange reserves at a multi-year low of 2.67M BTC. While supply is thin, the Spot CVD (Cumulative Volume Delta) remains flat, meaning the current price action is driven by low-liquidity “drift” rather than aggressive institutional buying.
The Institutional Barrier
My recent conversations with OTC (Over-The-Counter) desk traders indicate that while the Spot ETFs (notably FBTC and HODL) have recorded $56 billion in cumulative net inflows, the “buy-side” pressure has stabilized. Large allocators are waiting for a clear signal from the Federal Reserve before committing fresh capital above the $80,000 mark.
2. The $1.2 Billion Liquidity Trap
The most compelling case for a sudden spike isn’t fundamental—it’s structural. Derivatives markets are heavily skewed.
- Liquidation Heatmap: There is a dense cluster of leveraged short positions totaling $1.21 billion between $79,500 and $80,800.
- Negative Funding Rates: Perpetual futures funding rates have remained negative for a record 46 days. This “crowded short” trade is a contrarian bull signal; it provides the “fuel” for a vertical move if $80K is breached.
Pro-Tip: Watch the CME Gap. In 2026, institutional “weekend gaps” have become primary magnets for price action. A gap up on Sunday evening toward $78,500 would almost certainly trigger the $80K squeeze.
3. Macro Headwinds: The Fed and Geopolitics
Bitcoin is no longer an island. Its 0.74 correlation with the S&P 500 means it is behaving like a high-beta tech stock.
- The Fed’s Terminal Rate: With the Fed holding rates at 3.5%–3.75%, the cost of capital remains high. Any hint of a “higher for longer” stance in Jerome Powell’s upcoming press conference could send BTC back to retest the $72,000 support.
- Geopolitical De-escalation: The current two-week U.S.-Iran ceasefire is the primary reason for the 29% recovery. If the ceasefire is extended, “risk-on” sentiment will likely carry BTC through the $80K wall. If it collapses, $60,000 becomes the target again.
Pros & Cons of the Current Trend
Pros
- Structural Support: The $73,420 (50-day EMA) has held firm through three retests this month.
- Whale Accumulation: Addresses holding >1,000 BTC have increased their balance by 2.1% in April.
- Regulatory Tailwinds: Continued progress on the CLARITY Act is reducing “jurisdictional risk” for US-based funds.
Cons
- Range Fatigue: Bitcoin has been sideways for 60+ days; history shows these periods often end in a “washout” before the real move.
- Correlation Trap: BTC is currently failing to act as “Digital Gold” during geopolitical spikes, instead falling alongside tech equities.
- Volume Anomaly: The 29% rally occurred on 20% lower volume than the Q1 sell-off, a classic sign of a “weak-handed” recovery.
FAQ: Is the Bitcoin Bull Market Back?
– Is the 29% rally a “dead cat bounce”?
- Technically, it is not a dead cat bounce as long as BTC stays above the $74,000 support level. However, without a close above $80,000, it remains a “range-bound recovery” rather than a new bull trend.
– What triggers the $1.2B short squeeze ?
- A sustained move above $79,200 would force automated liquidations of short positions. This creates a feedback loop of buying that could propel price to $83,000 in hours.
– Why is $80,000 so hard to break ?
- $80K is not just a psychological number; it represents the 200-day EMA on several institutional charts and the level where many 2025 “top-buyers” are looking to exit at break-even.
– How does the Fed affect my Bitcoin holdings ?
- In 2026, Bitcoin acts as a liquidity barometer. High interest rates make BTC less attractive compared to “risk-free” yields. If the Fed signals rate cuts, Bitcoin is typically the first asset to rally.
– Should I buy now or wait for a pullback ?
- Institutional data suggests “laddering” entries between $72,000 and $75,000 while keeping a “breakout trigger” ready if the 4-hour candle closes above $80,200.
Financial Disclaimer: The cryptocurrency market is highly volatile. The data provided (from Glassnode, CryptoQuant, and others) is for informational purposes only. Never invest more than you can afford to lose. Historical performance (such as the 29% rally) is not an indicator of future results.