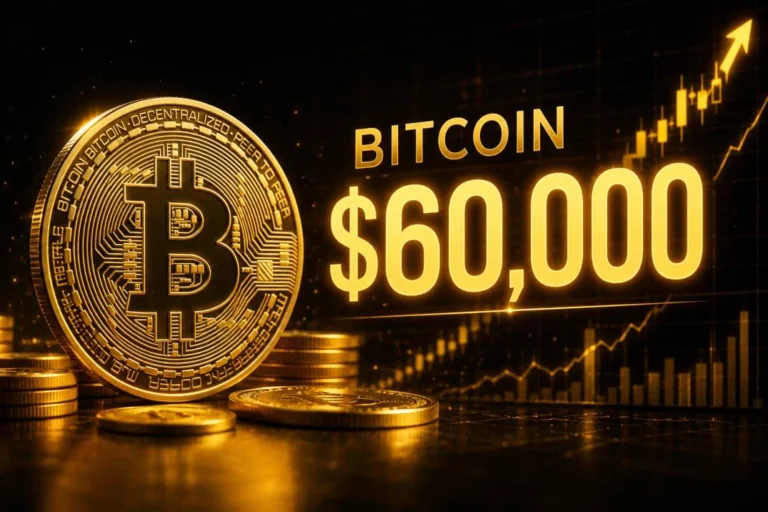
Bitcoin Stuck at $77K: The $1.2 Billion Short Squeeze That Could Define 2026
Bitcoin is currently playing a high-stakes game of “chicken” with the $80,000 psychological barrier. As of April 29, 2026, the flagship digital asset is oscillating between $77,200 and $77,600, a consolidation zone that has kept traders on edge for over a week. While retail sentiment remains in a state of “Fear” (Index: 32), institutional indicators suggest a massive volatility event is brewing.
This isn’t just another sideways crawl. Below the surface, a liquidity cluster worth over $1.2 billion in short positions is sitting just above the current price action. A break higher wouldn’t just be a rally; it would be a forced liquidation cascade.
The $80,000 Resistance: Why This Time is Different
Historically, Bitcoin has struggled with the $80K level throughout 2026, having been rejected four times already this year. However, the technical structure in late April differs from previous attempts.
1. The Short Squeeze Mechanics
Aggregated data from CoinGlass indicates that a push above $79,178 would trigger a “gamma-like” squeeze. We are seeing a symmetrical cluster of risk:
- To the Upside: $841 million in shorts are vulnerable above $79,178.
- To the Downside: $878 million in long positions face liquidation if BTC slips below $76,829.
When I look at the order books, the “sell wall” at $80,000 is thinning. If the current 21-week EMA (~$79,000) is reclaimed, the subsequent short covering could realistically propel BTC to the 200-day EMA near $84,000 within 48 to 72 hours.
2. Institutional Re-Engagement
After a brutal February and March, Glassnode reports that US spot Bitcoin ETF flows have turned modestly positive. The 7-day moving average has finally flipped back to green, indicating that institutional allocators are “buying the dip” of the $70,000–$75,000 recovery range.
Pro-Tip: Watch the aSOPR (Adjusted Spent Output Profit Ratio). In March, it sat below 1.0 (indicating selling at a loss). It is now trending toward 1.05, suggesting the market has moved from capitulation to “profitable holding.”
Macro Catalysts: The Binary Outcome
The market is currently frozen, waiting for a definitive “Go/No-Go” signal from two primary sources:
Geopolitical Tensions (US-Iran)
The crypto market has become a sensitive barometer for Middle Eastern stability. The expiration of the current ceasefire has introduced a “binary” trading environment.
- Bull Case: A diplomatic extension of the ceasefire would likely see a “risk-on” rally, sending BTC through the $80K wall.
- Bear Case: Renewed hostilities or a closure of the Strait of Hormuz could spike oil prices above $100, forcing a flight to cash and a retest of the $68,000 macro support.
Regulatory Clarity: The CLARITY Act
The Senate markup session for the CLARITY Act is scheduled for the end of April. This bill is the “Holy Grail” for 2026, aiming to provide a clear legal framework for US-based exchanges. Confirmation of a vote would provide the fundamental tailwind needed to sustain a breakout above $80,000.
Technical Deep Dive: Indicators to Watch
| Indicator | Value (April 29, 2026) | Signal |
| RSI (14-Day) | 64.98 | Bullish (Not Overbought) |
| Funding Rates | Negative (46 days) | Bullish (Short Bias/Squeeze Potential) |
| 21-Week EMA | ~$79,000 | Critical Resistance |
| Immediate Support | $74,397 (Fib 0.382) | Strong Cushion |
Institutional Analysis: The “Cash and Carry” Compression
One unique insight often missed by the broader market is the decline in the “basis trade.” Institutional capture of the Bitcoin basis (long spot/short futures) has compressed significantly since late 2025. This suggests that leverage is lower than it was during the peak of 2025, meaning any move—up or down—is likely driven by spot demand rather than just a “long-squeeze” liquidation.
Pros & Cons of the Current Setup
Pros
- Institutional Support: Positive ETF inflows for five consecutive trading days.
- Short Fuel: Massive liquidation pool at $80K acts as a “magnet” for price action.
- Whale Accumulation: Over 270,000 BTC moved to “accumulation addresses” in the last 30 days.
Cons
- Geopolitical Risk: High sensitivity to non-crypto news (oil, war).
- Macro Headwinds: Continued Fed hawkishness regarding the “terminal rate” could cap the upside.
FAQ: Bitcoin at $77,000
– Is Bitcoin a buy at $77K?
- For long-term holders, the $77K level represents a consolidation phase after a 30% recovery from 2026 lows. However, short-term traders should wait for a confirmed weekly close above $80,000 to avoid “fakeout” volatility.
– What happens if Bitcoin breaks $80,000?
- A break above $80,000 would likely trigger over $840 million in short liquidations, creating a “short squeeze” that could rapidly push the price toward the next resistance at $83,312 (0.618 Fibonacci level).
– Why is $80,000 such a strong resistance?
- $80K is a major psychological “round number” and aligns with the 21-week EMA, which has acted as a ceiling for Bitcoin throughout the 2026 recovery phase.
– What is the biggest risk for Bitcoin right now?
– The primary risk is a breakdown of geopolitical ceasefires, which would cause a “risk-off” event across all asset classes, potentially dragging BTC back to the $68,000–$70,000 range.
– Are institutions still buying Bitcoin?
- Yes. Recent data from April 2026 shows a reversal in ETF flows from negative to positive, alongside significant purchases from corporate treasuries like MicroStrategy.
Financial Disclaimer: The information provided in this article is for informational purposes only and does not constitute financial, investment, or legal advice. Cryptocurrency markets are highly volatile and involve significant risk. Always conduct your own research or consult a licensed financial advisor before making investment decisions.