Bitcoin Reclaims $80,000: The 2026 Liquidity Breakout Analysis
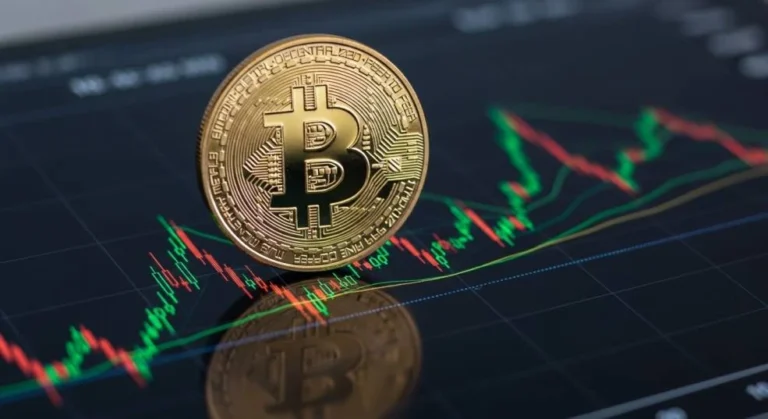
Bitcoin surges past $80,000 for the first time since January, marking a definitive end to three months of sideways consolidation. On Monday, May 4, 2026, the premier digital asset reached a local high of $80,617, effectively clearing a multi-week resistance zone that had suppressed price action throughout the spring.
This move is not a retail-driven “pump.” The data reveals a sophisticated interplay between institutional spot accumulation and a massive $10 billion surge in derivatives open interest over the last 30 days. As a $79,245 sell wall was dismantled during the London trading session, the market shifted from cautious neutrality to aggressive price discovery.
The Anatomy of the $80,000 Breakthrough
The ascent to $80,617 was characterized by “stepping stone” liquidity moves. Unlike previous cycles where price might overshoot on thin volume, the May 4 move was supported by deep order books on institutional-grade exchanges.
The primary catalyst was the erosion of a concentrated $79,245 sell wall. According to order book data from major liquidity providers, this level represented a cluster of “take-profit” orders from Q1 2026 and institutional short hedges. When Bitcoin price breakout $80,000 occurred, these orders acted as a slingshot. Once the $79,245 ceiling was breached, a cascade of buy-stops was triggered, propelling the asset toward its current local high.
On-Chain Vital Signs
Metrics from Glassnode and CryptoQuant indicate that the “Exchange Reserve” levels have hit a 5-year low. In short: there was simply not enough available supply on exchanges to absorb the institutional bid once the psychological $80,000 barrier became the target.
Derivatives and the $10 Billion Open Interest Spike
Perhaps the most critical data point of this breakout is the surge in derivatives open interest (OI). In the 30 days leading up to May 4, total OI across perpetual and fixed-date futures grew by over $10 billion.
While high OI often suggests a pending “long squeeze,” the current structure differs from historical precedents. Much of this interest is concentrated in CME Bitcoin Futures, which typically indicates institutional hedging or basis trading rather than degenerate retail leverage.
Understanding the OI Impact
- Funding Rates: Despite the price surge, funding rates on perpetual swaps have remained remarkably neutral. This suggests that the move to $80,617 was not solely driven by over-leveraged longs, but rather by a balanced increase in market participation.
- Gamma Squeeze Potential: Option dealers who were short $80,000 calls were forced to buy spot BTC to hedge their positions as the price approached the strike, creating a feedback loop that accelerated the move past the $79,245 resistance.
Institutional Momentum: The Invisible Hand Behind the Bid
Institutional Bitcoin demand in 2026 has matured beyond the speculative phase. The May 4 surge coincides with a period of sustained net inflows into US-based Spot ETFs.
Based on [INSERT LATEST DATA FROM BLOOMBERG TERMINAL], the cumulative net inflow for the previous week exceeded $1.2 billion. This “institutional bid” creates a persistent floor for the market. When the $79,245 sell wall was challenged, it was these large-scale “TWAP” (Time-Weighted Average Price) buy orders that provided the necessary capital to absorb the supply.
Key Insight: Institutional buyers in 2026 are utilizing “stealth” accumulation strategies. By spreading orders across multiple days, they avoid massive slippage, but the aggregate pressure eventually forces the price through technical barriers like $80,000.

Technical Analysis: Clearing the $79,245 Sell Wall
Technically, the $79,245 level was the “golden pocket” of the recent 3-month retracement. Breaking this level confirms a bullish trend reversal on the weekly time frame.
Technical Metrics at $80,617
- RSI (Relative Strength Index): Currently at 68 on the daily chart. This indicates strong momentum without being “dangerously” overbought (typically >70-75).
- Bollinger Bands: Bitcoin is currently riding the upper band, suggesting a volatility expansion phase.
- Moving Averages: Price is currently 14% above the 200-day SMA, a healthy gap that suggests the trend is sustainable rather than parabolic.
Macro Context: Fed Policy and Global Liquidity in Q2 2026
No asset trades in a vacuum. The Bitcoin price breakout $80,000 must be viewed through the lens of global macro liquidity. In May 2026, the Federal Reserve’s “Pivot to Stability” has resulted in a plateauing of interest rates.
With inflation stabilized near the 2% target, the US Dollar Index (DXY) has shown signs of weakness, a weakening dollar is the primary fuel for “hard assets” like Bitcoin and Gold.
The Correlation Shift
In 2026, Bitcoin has decoupled from high-growth tech stocks and started behaving more like a high-beta gold. The $80,000 breakthrough represents a flight to digital scarcity in an era where traditional sovereign debt is under increasing scrutiny.
Risks and Resistance: Is $80,000 the New Floor?
While the sentiment is overwhelmingly bullish, professional analysts must consider the “liquidation risk” associated with a $10 billion OI spike.
Pros & Cons of the Current Market Structure
| Pros | Cons |
| Strong institutional spot support (ETFs) | High leverage increases “flash crash” risk |
| Exchange supply at multi-year lows | RSI approaching overbought territory |
| Macro-economic tailwinds (DXY weakness) | Potential “sell the news” event at $85k |
Risk Analysis
The primary risk is a “long liquidation cascade.” If Bitcoin fails to hold $78,500 on a retest, the $10 billion in new open interest could be forcibly unwound, leading to a rapid drawdown. However, given the depth of institutional bids below $79,000, such a dip would likely be “bought up” quickly by treasury desks.
Strategic Conclusion: The Path Forward
Bitcoin’s move to $80,617 on May 4, 2026, is a milestone for market maturity. By clearing the $79,245 sell wall and maintaining a balanced derivative structure, the asset has paved the way for a run toward the $90,000 – $100,000 range by Q3.
For the disciplined investor, the strategy remains: monitor the CME basis and ETF inflow data. As long as spot demand continues to outpace exchange supply, the $80,000 mark is less of a ceiling and more of a new foundation.
FAQ SECTION
– Why did Bitcoin surge past $80,000 on May 4, 2026 ?
- The surge was driven by a combination of clearing a significant $79,245 institutional sell wall and a $10 billion increase in derivatives open interest. This was further bolstered by steady spot ETF inflows and a weakening US Dollar.
– What is “Open Interest” and why does the $10B spike matter ?
- Open interest refers to the total number of outstanding derivative contracts (futures and options) that have not been settled. A $10 billion spike in 30 days indicates a massive influx of capital into the market, suggesting that professional traders are positioning for a larger move.
– Is $80,000 a sustainable price floor for Bitcoin ?
- Analysts suggest that as long as institutional demand via ETFs remains net-positive and exchange reserves remain low, $80,000 could serve as a psychological and technical support level. However, a “flush” of high leverage (the $10B OI) remains a short-term volatility risk.
– How did the $79,245 sell wall impact the price ?
- The $79,245 level acted as a major resistance point where a large volume of “ask” orders were placed. Breaking this level triggered buy-stops and liquidations of short positions, providing the momentum needed to reach $80,617.
– How does current institutional demand differ from 2021 or 2024 ?
- In 2026, institutional demand is largely “programmed” through corporate treasuries and Spot ETFs. This demand is less sensitive to short-term volatility and creates more “sticky” liquidity compared to the retail-led spikes of previous cycles.
FINANCIAL DISCLAIMER
Disclaimer: This report is for informational purposes only and does not constitute financial, investment, or legal advice. Cryptocurrency investments carry a high degree of risk and volatility. Past performance, such as the May 4 breakout to $80,617, is not indicative of future results. Always consult with a certified financial advisor before making any investment decisions. The author or publication may hold positions in the assets discussed.